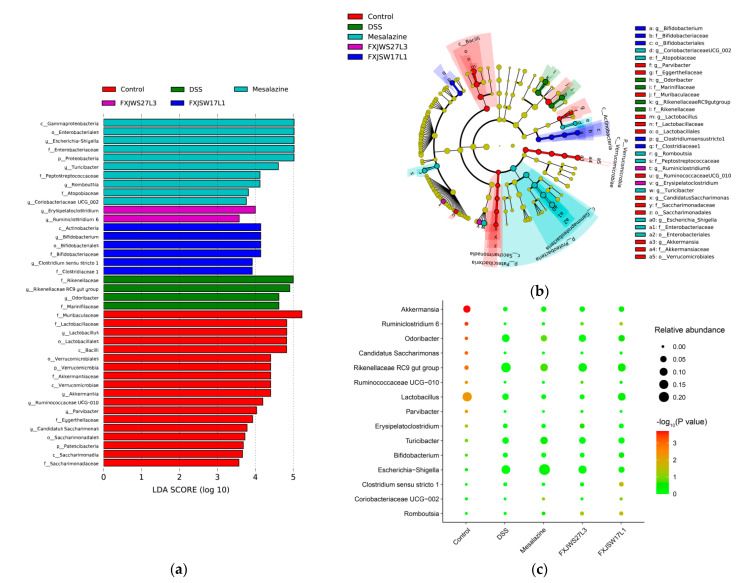
Figure 8.
Effects of L. ruminis on dominant microorganisms. (a) Distribution histogram based on LDA, with a log LDA score above 3.0. The LDA histogram shows the species with significant differences, which are larger than the preset value. The color of the histogram represents each group, and the influence degree of the species with significant differences between different groups can be expressed according to the length of the histogram. (b) Cladogram based on LDA, with a log LDA score above 3.0. The circles radiating from the inside to the outside represent taxonomic levels from phylum to genus.The diameter of the small circles represents the relative abundance. (c) Relative abundance of the genus with significant differences in relative abundance between groups. All groups were compared with the DSS group.

