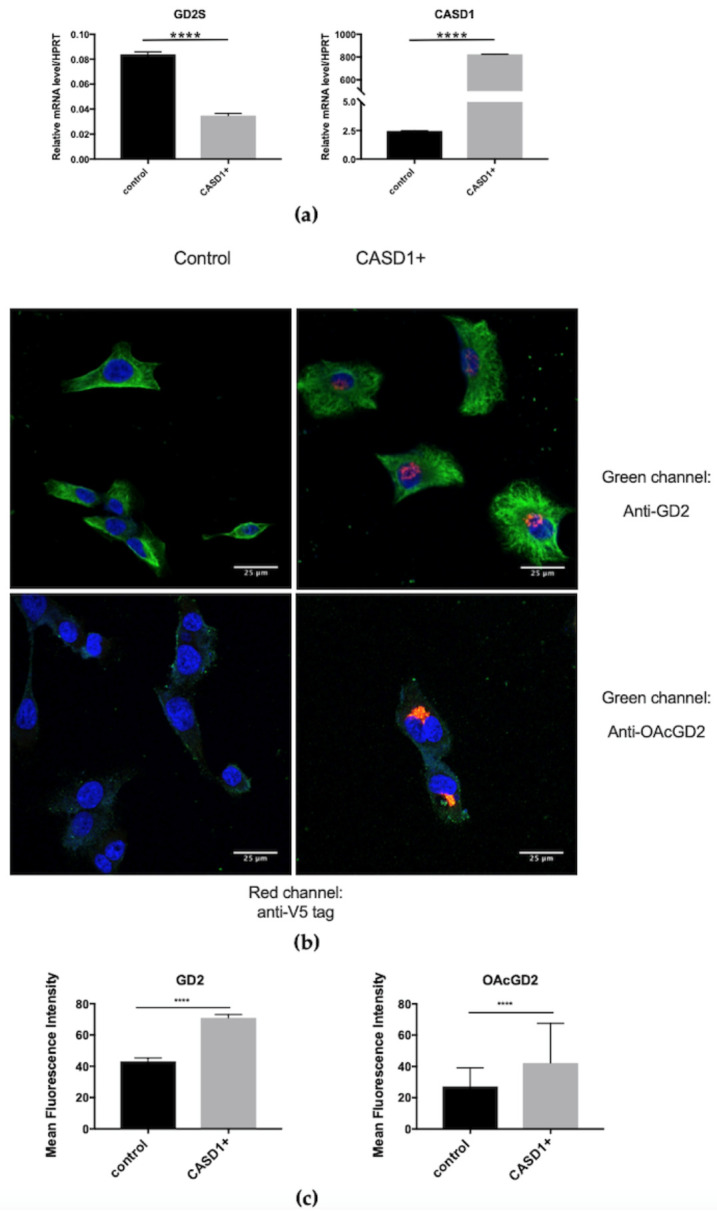
Figure 6.

Increased OAcGD2 expression in CASD1 overexpressing SUM159PT cells using plasmid transfection (CADS1+). (a) qPCR quantification of GD2S and CASD1 genes in transiently transfected SUM159PT cells (n = 3). Results were normalized to the expression of HPRT mRNA. (b) Representative images of the analysis of GD2, OAcGD2 and V5-tag expression in BC cells by immunochemistry and confocal microscopy (n = 3). The cells were incubated with anti-V5-tag and either anti-GD2 or anti-OAcGD2 mAbs. Gangliosides were visualized using IgG conjugated-Alexa Fluor 488 and V5-tag using IgG conjugated-Alexa Fluor 546. The nuclei were counterstained with DAPI. All of the images were taken in the same settings. Scale bar: 25 µM. (c) Quantification of mean fluorescence intensity of GD2 and OAcGD2. Statistical difference using unpaired t-test: **** p < 0.0001; ns: non-significant.
