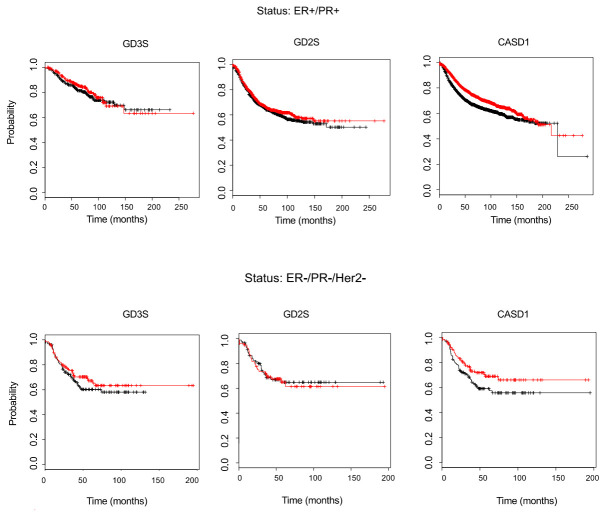
Figure 9.
Kaplan–Meier survival plot in BC patients. The database integrates gene expression and clinical data simultaneously. The two patient cohorts are compared by a Kaplan–Meier survival plot, and the hazard ratio with 95% confidence intervals and log rank p value are calculated [31]. GD3 synthase, GD2 synthase, and CASD1 expression are assessed in ER+/PR+ BC patients (upper) and ER-/PR-/Her2- BC patients (bottom). The black line represents the overall survival of patient with a low gene expression. The red line represents the overall survival of BC patients with high gene expression.

