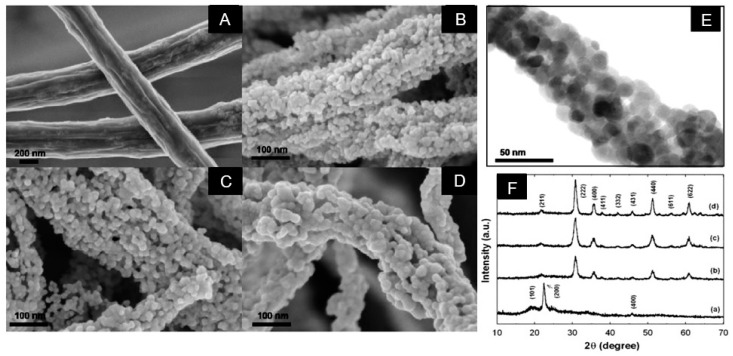
Figure 6.
SEM images of (A) as prepared PVA/indium acetate composite nanofibers, (B) after annealing at Tan = 400 °C, (C) Tan = 500 °C, and (D) Tan = 600 °C; (E) TEM images of In2O3 NF after calcination at T = 500 °C; (F) XRD patterns for (a) as prepared PVA/indium acetate composite nanofibers, (b) after annealing at T = 400 °C, (c) T = 500 °C, and (d) T = 600 °C. Reprinted with permission from [91]. Copyright 2010 Elsevier.

