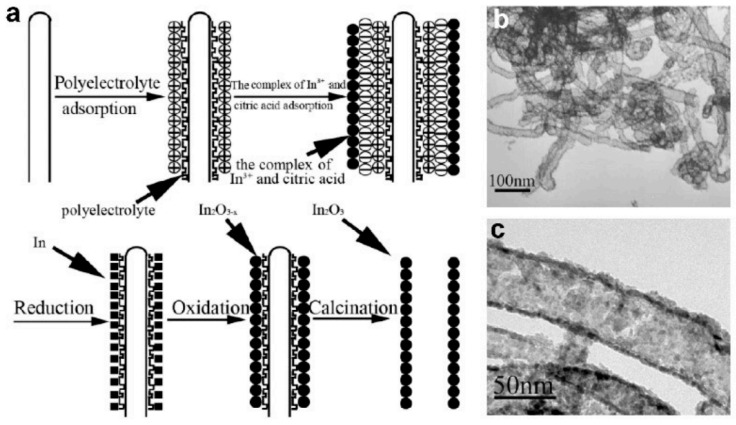
Figure 11.
(a) Schematic diagram for the growth process of In2O3 hollow nanofibers. (b,c) TEM images of regular In2O3 nanotubes prepared by the calcination of In2O3/polyelectrolyte/CNT nanocomposites at 550 °C in O2 for 3 h. Reprinted with permission from [156]. Copyright 2007 Wiley.

