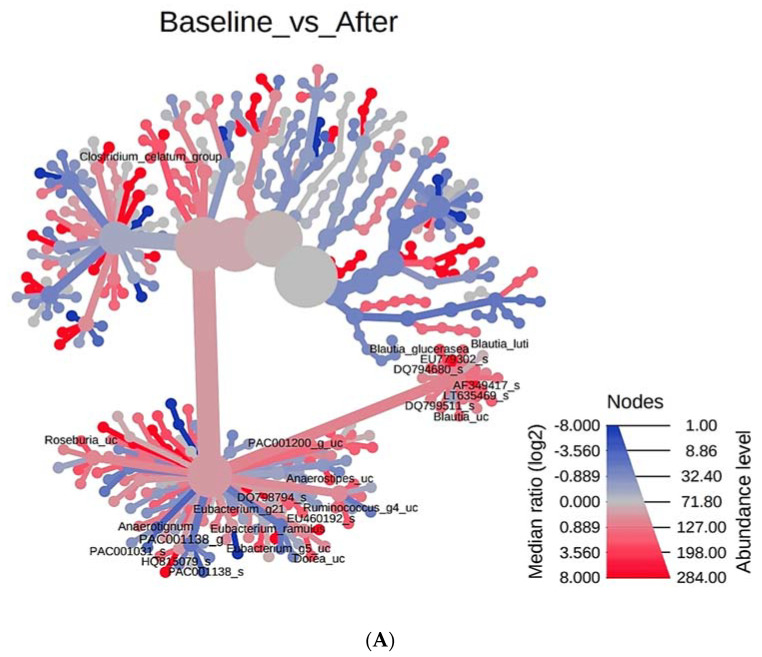
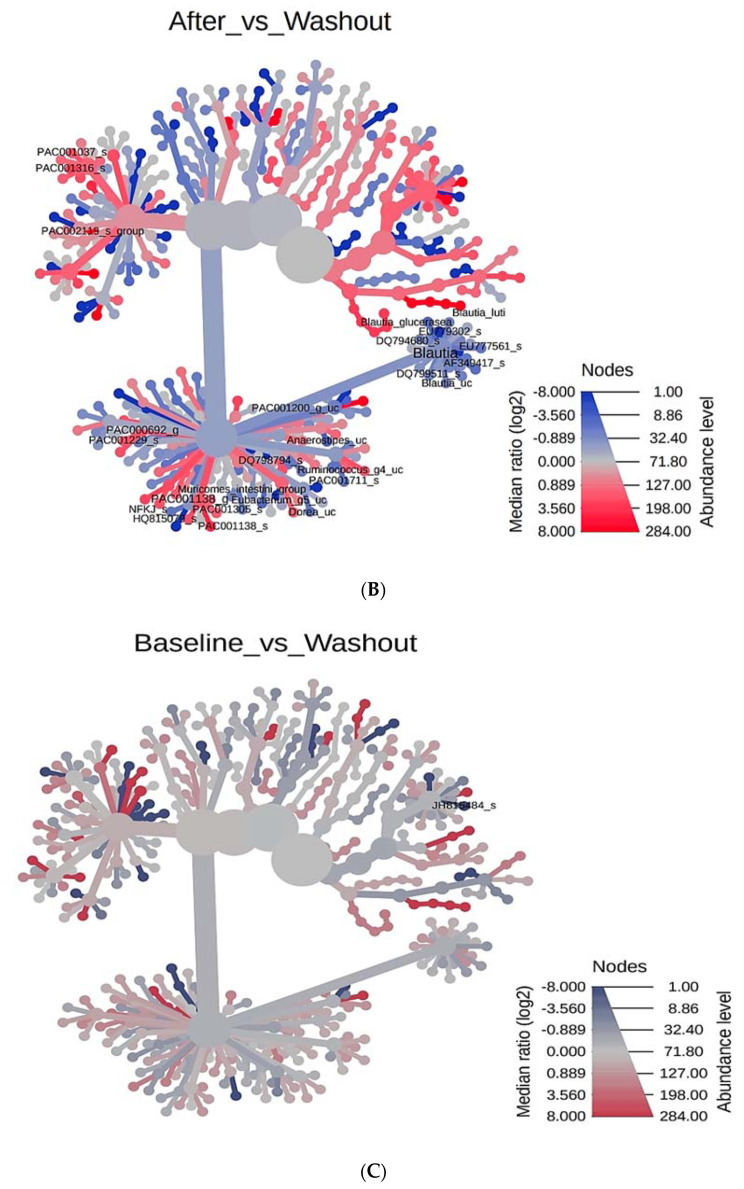
Figure 3.
Wilcoxon single rank sum test_Heat tree. For pairwise comparisons with two or more groups, we used a heat tree, a graphing technique called a heat tree matrix. Heat tree of factor Space. Heat Trees report the effect of the presence of vitis vinifera roots on hierarchical structure of taxonomic classifications (median abundance, non-parameter Wilcoxon Rank Sum test). (A) Comparison between Baseline and After. (B) Comparison between After and Washout. (C) Comparison between baseline and washout. Each picture is marked with a different color for the level of abundance. Marked in red, it means that the value of the Median ratio (log2) increases and the abundance is high. On the other hand, indicated in blue indicates that the Median ratio (log2) is decreased and the abundance is low.


