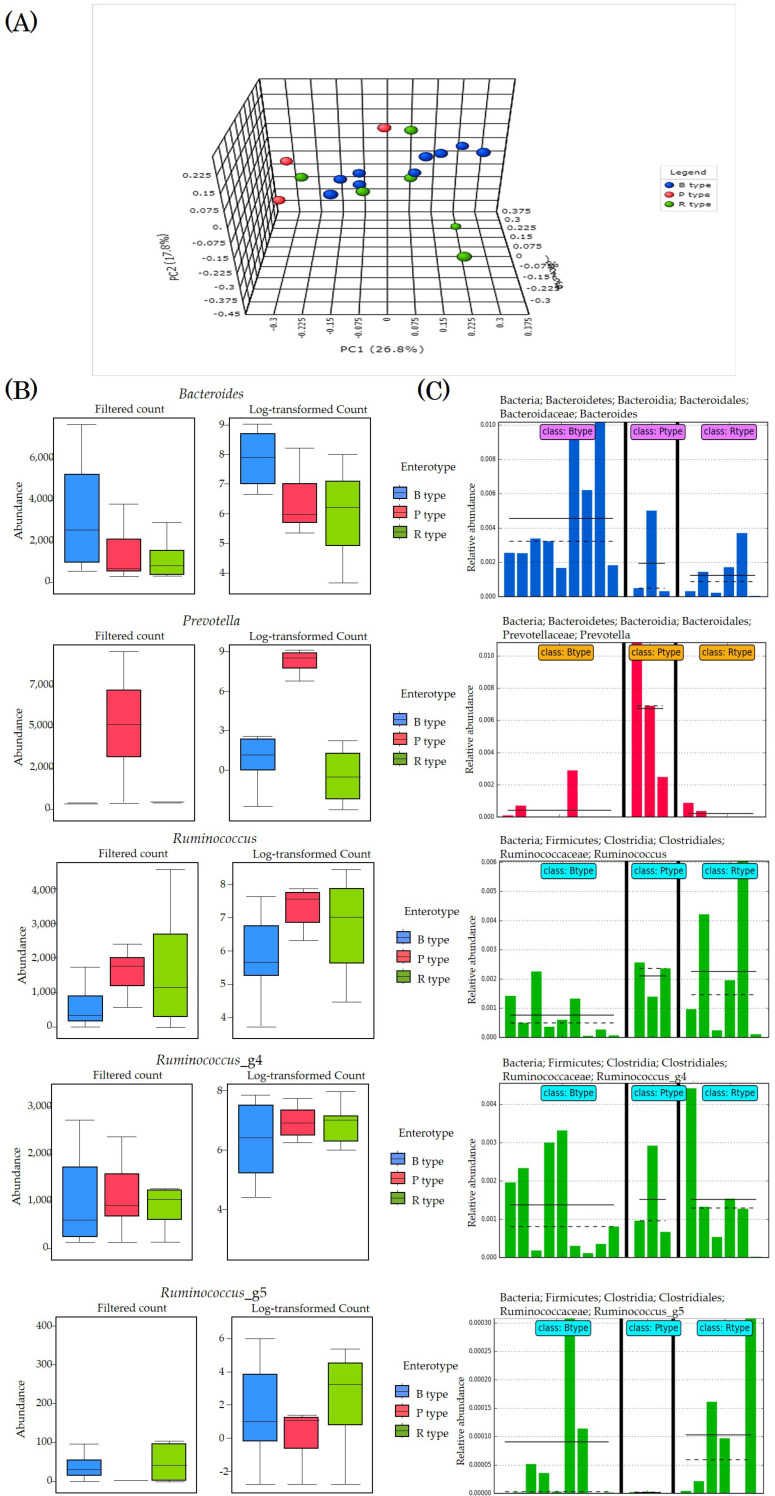
Figure 4.
Enterotyping of all subjects. (A) PCoA for Genus level based on Bray–Curtis index through PERMANOVA analysis. Type B is marked with red plots (n = 9), P type with blue plots (n = 3), and R type with green plots (n = 6). (B) Classical Univariate Statistical Comparisons. Taxonomy level was Genus level, Experimental factor was Enterotype, Statistical method was Kruskal–Wallis, and adjusted p-value cutoff was performed at 0.05. (C) Plot One Feature showing the distribution of a single variable. Plot One Feature can draw histograms and histograms of specific species of biomarkers from different sample groups. The different groups in the figure are separated by a solid black line. The solid line in each group of histograms represents the average value of the sample expression level of the group, and the dashed line represents the median value of the sample expression level of the group. Bacteroides of B type are blue bars, Prevetella of P type are red bars, and Ruminococcus of R type (and Ruminococcus_g4, Ruminococcus_g5) are green bars.

