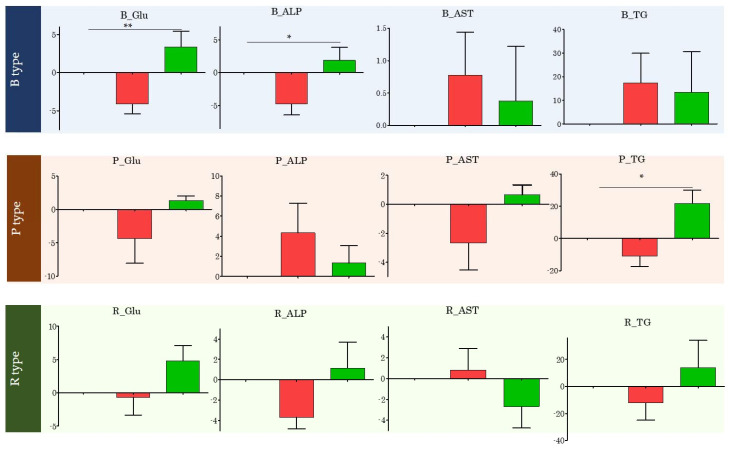
Figure 5.
Changes in specific blood index values by Enterotype of all subjects. This picture was created to observe the change effectively. The red bar shows the change in after by setting the baseline value to 0 (reference point). The green bar shows the change in Washout by setting the value of after to 0 (reference point). One-way-ANOVA analysis was performed. * p < 0.05, ** p < 0.01.

