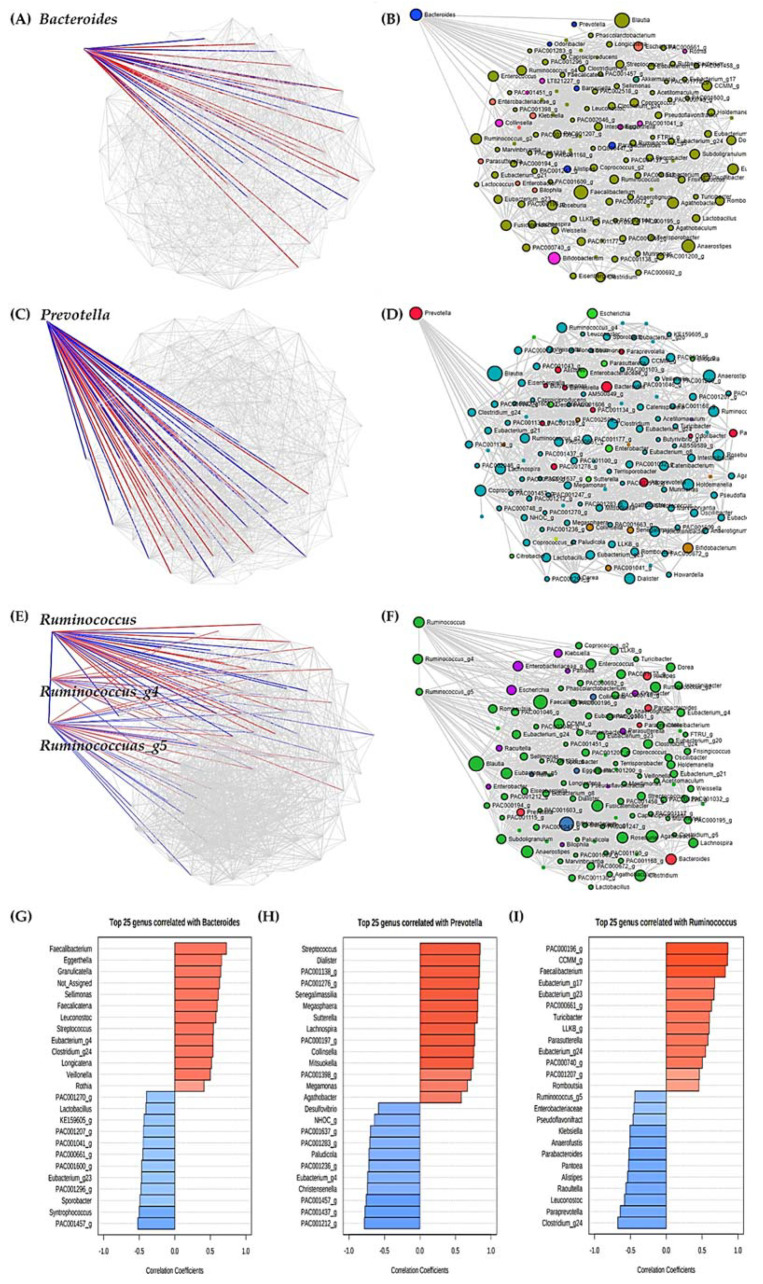
Figure 7.
Correlation analysis between main strains of each enterotype and other strains. (A) SparCC between Bacteroides and other strains. (B) Line between bacteria with significant correlation with Bacteroides. (C) SparCC between Prevotella and other strains. (D) Line between bacteria with significant correlation with Prevotella. (E) SparCC between Ruminococcus (and Ruminococcus_g4, Ruminococcus_g5) and other strains. (F) Line between bacteria with significant correlation with Ruminococcus (and Ruminococcus_g4, Ruminococcus_g5). Algorithm performed SparCC, which assumed sparse networks and performed iterations using log-ratio transformation and identified taxa with high correlation. Permutation (SparCC) performed 100. Taxonomy level was Genus level, and p-value threshold was performed as 0.05. The experimental factor was Enterotype, the correlation threshold was set to 0.3, and the coloring options were set differently for each Phylum. (G) Overall pattern search between Bacteroides and other strains according to PYP intake. (H) Overall pattern search between Prevotella and other strains according to PYP intake. (I) Overall pattern search between Ruminococcus and other strains according to PYP intake. Taxonomy level was performed with Genus. Distance measure was performed by SparCC, and experimental factor was performed by timepoint.

