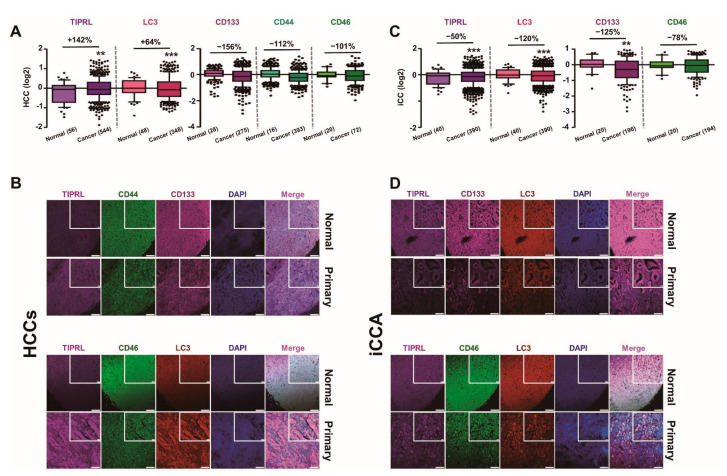
Figure 1.
Differential expression of all five variables, depending on liver cancer cell types. Human liver cancer tissues were stained with the indicated antibodies followed by confocal observation. (A,C) The levels of all five variables were obtained using the ZEN program, and then global normalization was carried out (Tables S2 and S3). p-values (** p < 0.01; *** p < 0.001) were determined by a paired t-test, and % differences are shown. (n) is the number of samples. (B,D) The images represent normal and HCCs (B)/iCCA (D), respectively. DAPI was used for nucleus staining, and scar bars, 20 μm (inserted), and 100 μm.

