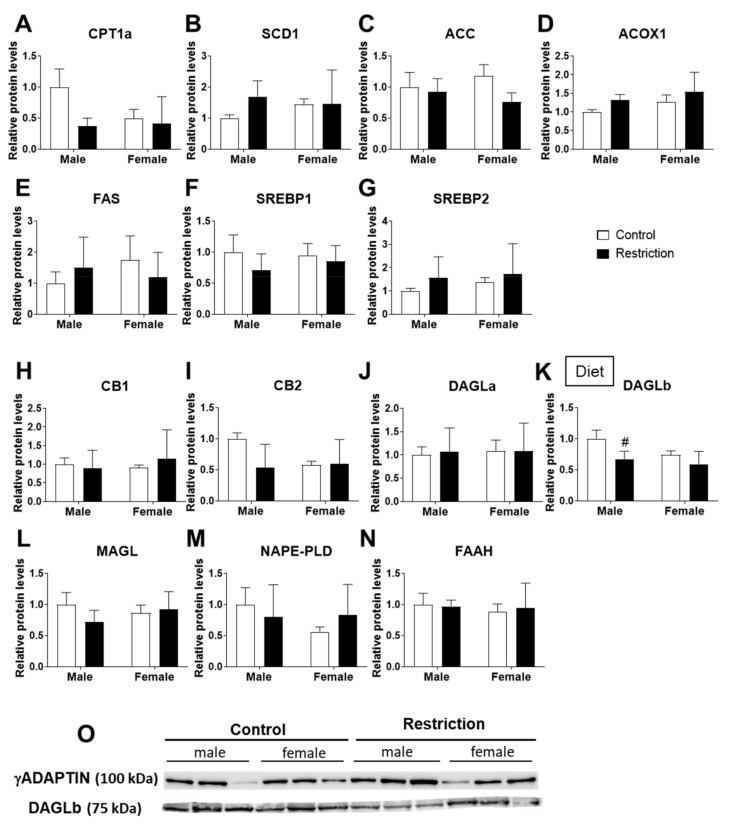
Figure 4.
Effect of maternal caloric restriction on protein levels of principal factors of lipid metabolism: Cpt1a (A), Scd1 (B), Acc (C), Acox1 (D), Fasn (E), Srebf1 (F) and Srebf2 (G); and the endocannabinoid system: Cnr1 (H), Cnr2 (I), Dagla (J), Daglb (K), Magl (L), Nape-pld (M) and Faah (N) in the hypothalami of male and female offspring at postnatal day 2. Representative membranes of the main changes (O). Data are expressed as the mean ± S.E.M. (control male: n = 11; restriction male: n = 9; control female: n = 10; restriction female: n = 6. Tukey or single-effect analysis: # p < 0.05/0.01/0.001 vs. same-sex control group. The main results of the two-way ANOVA (effect of sex, diet and/or sex × diet interaction) are indicated above the graphs.

