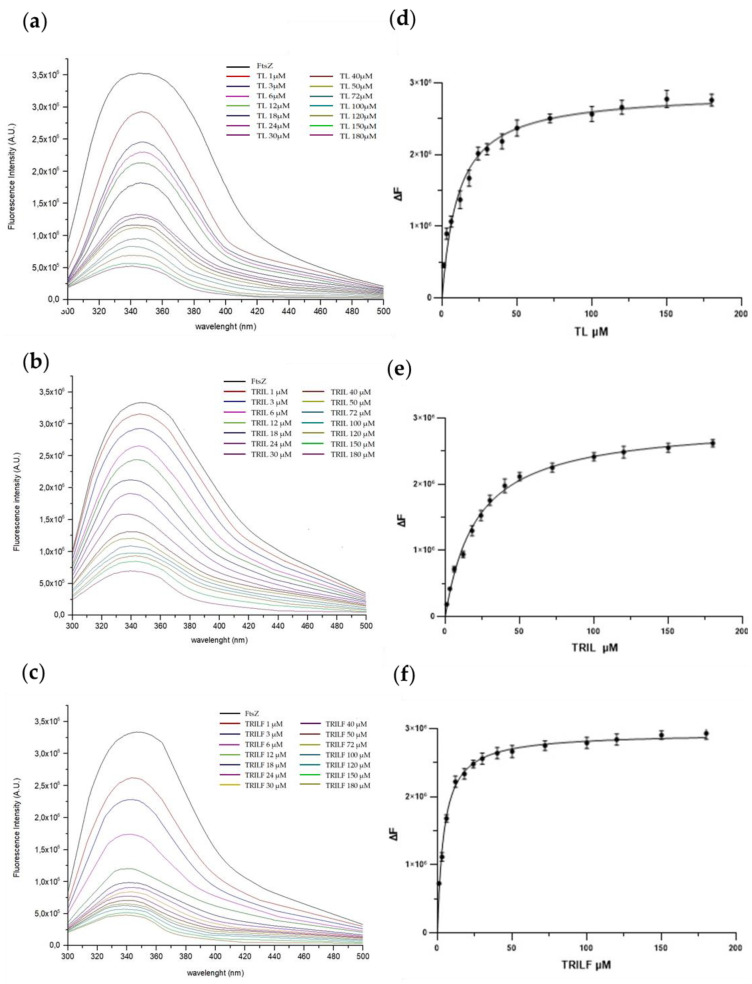
Figure 4.
Left panel: Spectrofluorimetric titration of FtsZ (12 μM) in complex with native TL (a), TRIL (b) and TRILF (c) from 1 to 180 μM, was performed by monitoring the emissions at 347 nm at 20 °C. Right panel (d–f): Diagram plots extrapolated from fluorescence data. The experiments were performed in duplicate and the standard deviation is reported as error bars.

