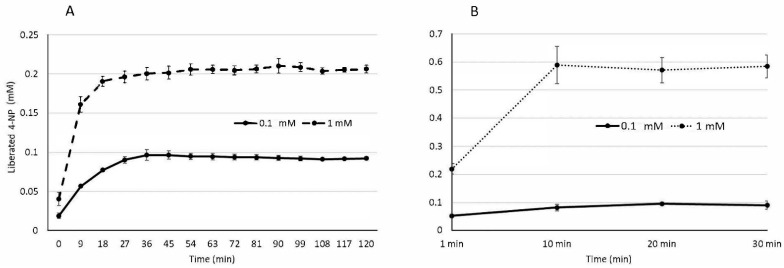
Figure 1.
Enzyme kinetics graph of liberated reaction product, NP, over time from two substrate concentrations (1 mM and 0.1 mM NPP) and two enzyme and bile combinations (A) lipase:pancreatin (1:2) (B) lipase:pancreatin:bile (1:2:3). Values are averaged from three biological replicates (n = 3). ±SE bars are displayed.

