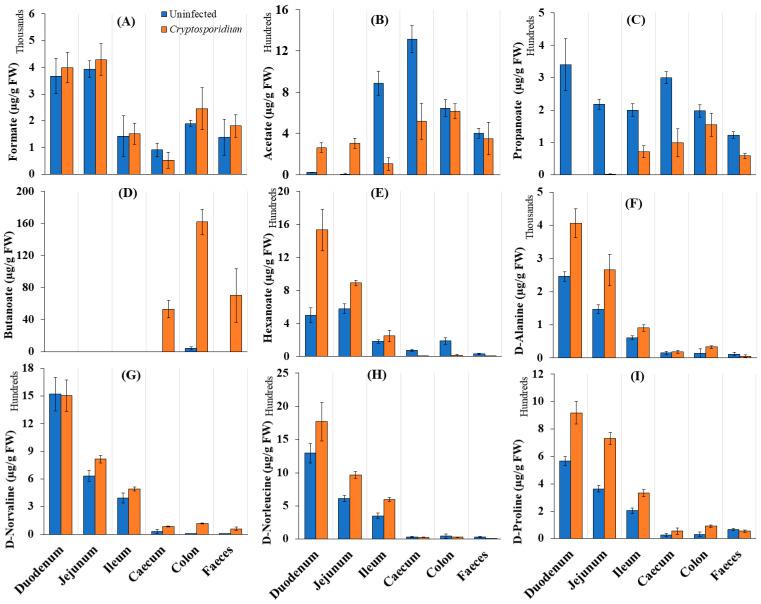
Figure 4.
Distribution of (A–E) short chain fatty acids (SCFAs) and (F–I) D-amino acids across various regions of the intestinal tract (µg/g FW of samples) of uninfected and Cryptosporidium-infected mice. Note: The error bars represent standard deviation between the experimental replicates of each organ (n = 5).

