
Figure 2.
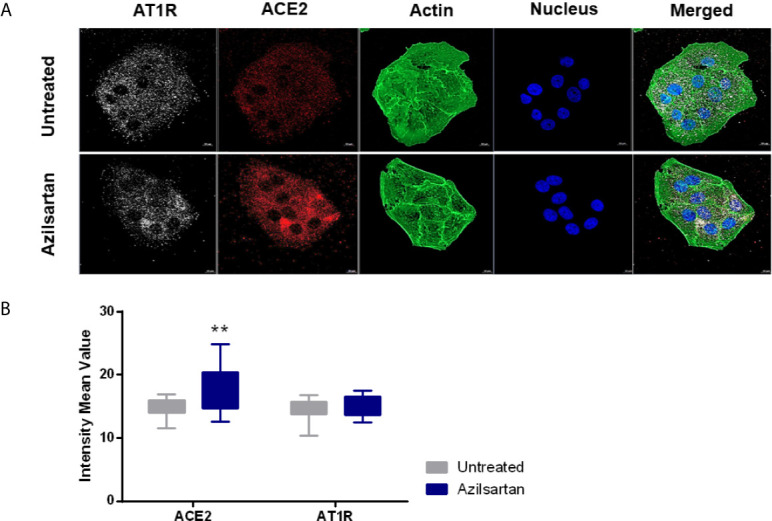
Modulation of cell surface-expressed ATR1 and ACE2 molecules in Vero E6 cells non-infected and treated with Azilsartan (15 µM) for 72 hours by immunofluorescence microscopy. (A) The panel presents non-infected cells after incubation with Azilsartan (15 µM) and evaluating the fluorescence corresponding to the ATR1, ACE2, Actin, and the nucleus of the cells. The merge of the images is displayed at the right of the panel. Images were acquired using a confocal microscope (Zeiss LSM 800) with a 63X/1.4 oil objective. (B) Quantitative representation of Mean Fluorescence corresponding to ATR1 and ACE2 molecule expression on VERO E6 cells treated or not treated with Azilsartan. **P < 0.01.