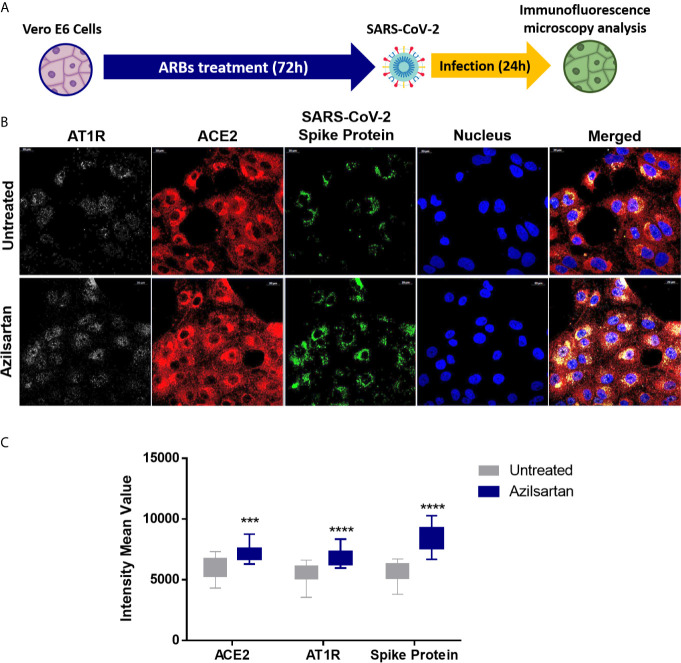
Figure 4.
Modulation of cell surface-expressed ATR1 and ACE2 molecules in Vero E6 cells infected with SARS-CoV-2 (24 h.p.i) and treated with Azilsartan (15 µM) for 72 hours by immunofluorescence microscopy. (A) Schematic flow of the analysis: Vero E6 cells were treated with various ARBs (the MTT assay previously defined non-cytotoxic concentrations: Azilosartan 15µM; Eprosartan 30µM; Irbesartan 60µM; Losartan 7µM; Olmesartan 15µM; Telmisartan 7µM; Valsartan 7µM) for 72 hours and were subsequently infected for analysis of ACE2 and ATR1 on treated and infected cells, 24 hours post-infection (h.p.i.). (B) The panel presents SARS-CoV-2 infected cells after incubation with Azilsartan (15 µM) and evaluation of fluorescence corresponding to the ATR1, ACE2, viral spike protein, and the nucleus of the cells. The merge of the images is displayed at the right of the panel. Images were acquired using a confocal microscope (Zeiss LSM 800) with a 63X/1.4 oil objective. (C) Quantitative representation of Mean Fluorescence corresponding to ATR1 and ACE2 molecules expression on VERO E6 cells treated or not treated with Azilsartan and SARS-CoV-2 in the cells. ***P < 0.001; ****P < 0.0001.

