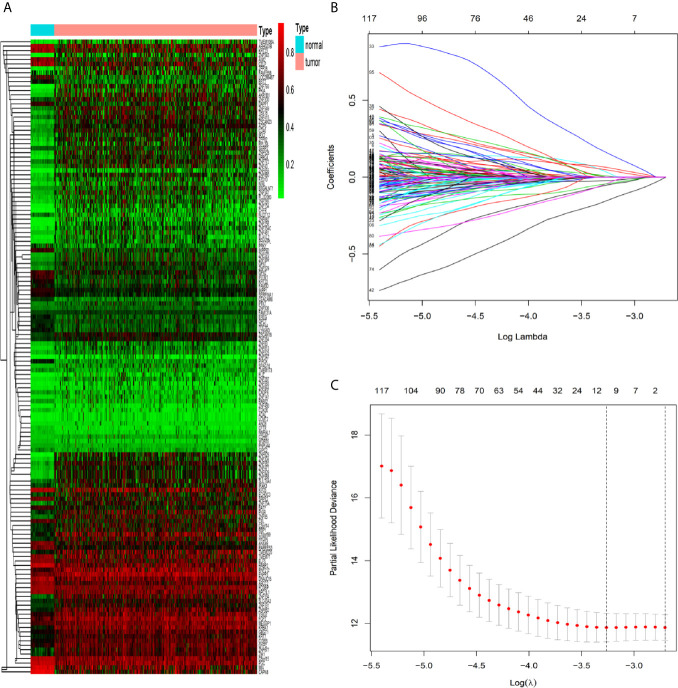
Figure 1.
Identification of methylation-driven genes in CRC patients. (A) Heat map of 143 CRC-related methylation-driven genes. The color change from green to red illustrates a trend from hypomethylation to hypermethylation. |log FC|≥0, adjusted P < 0.05, and Cor <−0.5. CRC, colorectal cancer; FC, fold change. (B) Selection of driven genes in the LASSO model. (C) Tuning parameter (λ) selection in the LASSO model used cross-validation via the maximum criteria. The dotted vertical lines were drawn at the optimal values using the maximum criteria and the one standard error of the maximum criteria.

