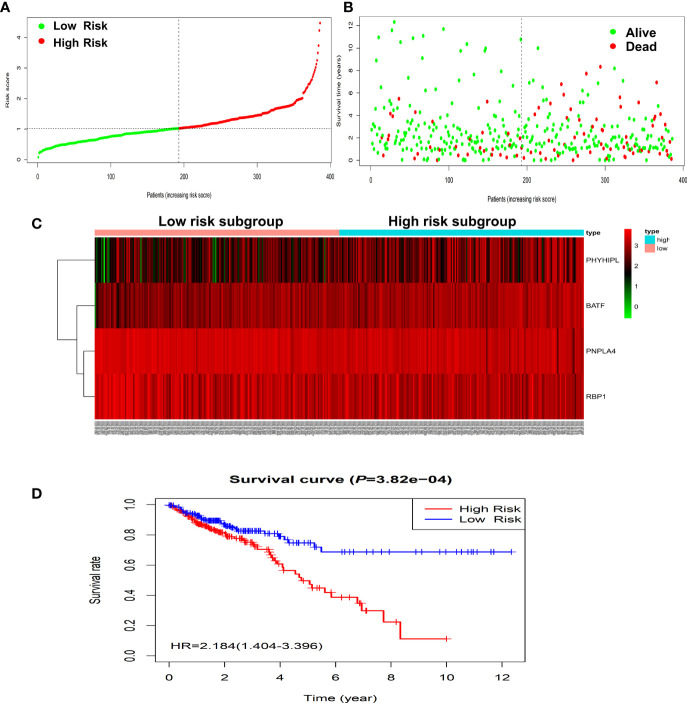
Figure 2.
Construction of four-gene risk score model in the TCGA dataset. (A) Distribution of risk scores in the high-risk and low-risk groups. (B) Survival overview in two high-risk and low-risk groups. (C) Heatmap of the four-gene expression profiles corresponding risk scores in the high-risk and low-risk groups in the TCGA database. (D) Comparison of OS between the high-risk and low-risk groups. OS, overall survival.

