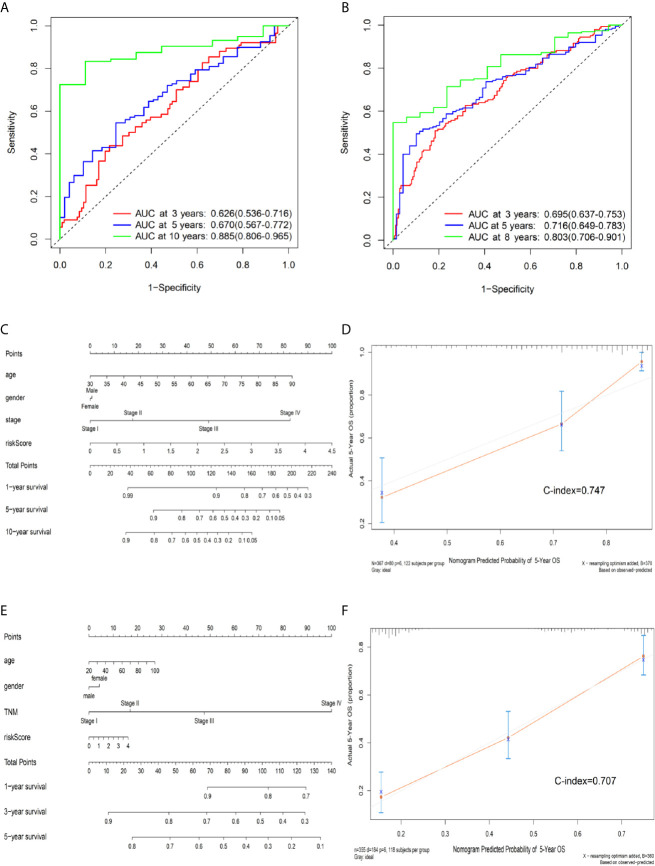
Figure 4.
Predictive OS performance of the signature using time-dependent ROC analysis and the nomogram in training and validation sets. (A) Time-dependent ROC curves analysis for the 3-, 5-, and 10-year OS prediction by signature in the training set. (B) Time-dependent ROC curves analysis for the 3-, 5-, and 8-year OS prediction by signature in the testing set. (C) Nomogram to predict the 1-, 5-, and 10-year OS of CRC patients in the training set. (D) Calibration curves of 5-year OS nomogram model in the training set. (E) Nomogram to predict the 1-, 3-, and 5-year OS of CRC patients in the testing set. (F) Calibration curves of 5-year OS nomogram model in the testing set. The gray line represents the ideal predictive model, and the red line represents the observed model.

