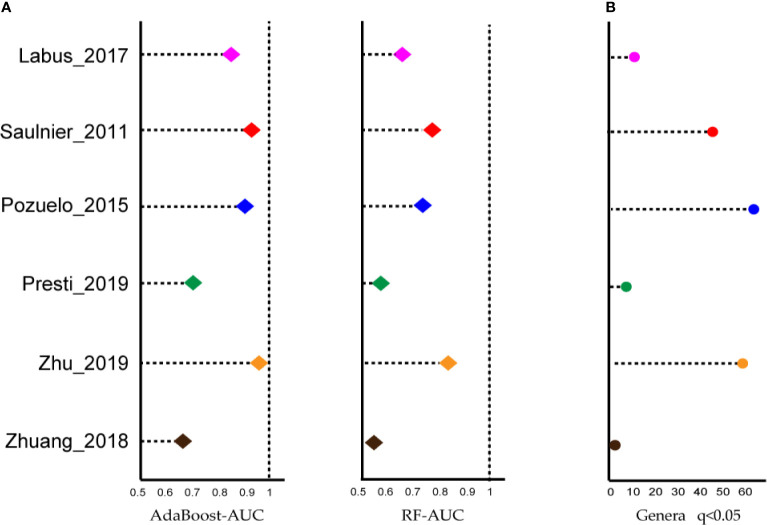
Figure 2.
Most of the studies showed microbiome changes, and potential signatures were found at genus-level in each dataset. (A) Left: Area under the ROC curve (AUC) is calculated by the AdaBoost algorithm. Right: Area under the ROC curve (AUC) is calculated by the random forest algorithm. X-axis starts at 0.5. (B) The number of genera biomarkers with p < 0.05 were identified by linear discriminant analysis effect size (LEfSe) analysis.

