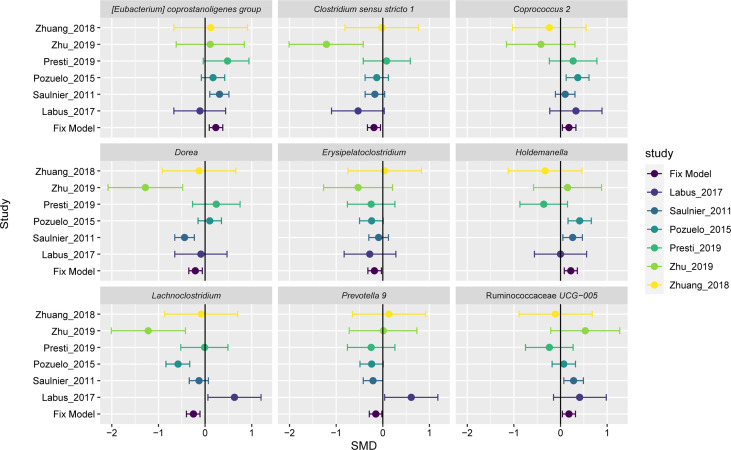
Figure 4.
Forest plot reporting effect sizes calculated using a meta-analysis of standardized mean differences and a fixed-effects model on nine genera abundances between carcinomas and controls. The SMD had a positive value confirming the higher number of genera in patients with IBS, and a negative value showing more abundance of genera in healthy controls. The length of the error bar depicts the 95% CIs. The fixed model indicates the overall effect sizes SMD value of all studies.

