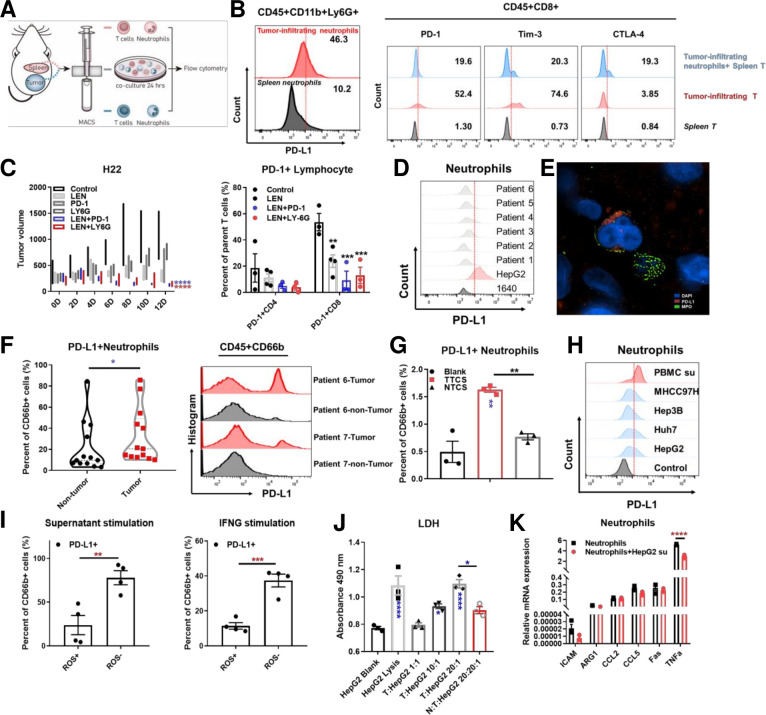
Figure 2.
The effect of tumor-associated neutrophils on lenvatinib treatment in H22 BALB/c mice models and cytotoxicity of T cells in ex vivo the diagram and representative flow cytometry images showing the expression of PD-L1 on tumor infiltrating neutrophils and spleen neutrophils isolated from BALB/c mice models subcutaneously implanted with H22 cells (A, B). Representative flow cytometry images showing the expression of PD-1, Tim-3 and CTLA-4 on spleen T cells, tumor infiltrating T cells and spleen T cells cocultured with tumor infiltrating neutrophils isolated from BALB/c mice models subcutaneously implanted with H22 cells (B). Mean tumor volume for different treatments (control, lenvatinib, anti-PD1 antibody, anti-Ly-6G antibody, lenvatinib combining anti-PD1 antibody and lenvatinib combining anti-Ly-6G antibody) in BALB/c mice models subcutaneously implanted with H22 cells over 10 days of treatment (n=3 per group) and histogram showing the proportion of PD-1 +CD4 and CD8 cells in each treatment group (C). The expression of PD-L1 on neutrophils in peripheral blood isolated from HCC patients (D). Representative N-SIM image showing PD-L1 expression and MPO positive cells infiltration in HCC patients tissue samples (red: PD-L1; green: MPO; blue: DAPI) (E). Histogram (left) and representative flow cytometry images (right) showing the expression of PD-L1 on neutrophils infiltrating in tumor and non-tumor tissues isolated from HCC patients (F). Representative flow cytometry images (left) and histogram (right) showing the expression of PD-L1 on neutrophils stimulated by tumor tissue culture supernatant compared with non-tumor tissue culture supernatant (G). Representative flow cytometry images showing PD-L1 expression levels on neutrophils stimulated by supernatant derived from PBMC, MHCC97H, Hep3B, HUH seven and HepG2 for 24 hours (H). The correlation of PD-L1 expression and ROS production in neutrophils stimulated by HepG2 supernatant and IFNG assessed by flow cytometry (I). LDH assay for the effect of neutrophils on T cell cytotoxicity with different effector (T cells) and target (HepG2 cells) ratio in coculture system (J). Histogram showing the relative mRNA expression in neutrophils stimulated by HepG2 supernatant versus control (K). *P<0.05, **p<0.01, ***p<0.001, ****p<0.0001. HCC, hepatocellular carcinoma; IFNG, interferon gamma; LDH, PBMC, peripheral blood mononuclear cell; PD-1, programmed cell death-1; PD-L1, programmed cell death-1 ligand; ROS, reactive oxygen species.

