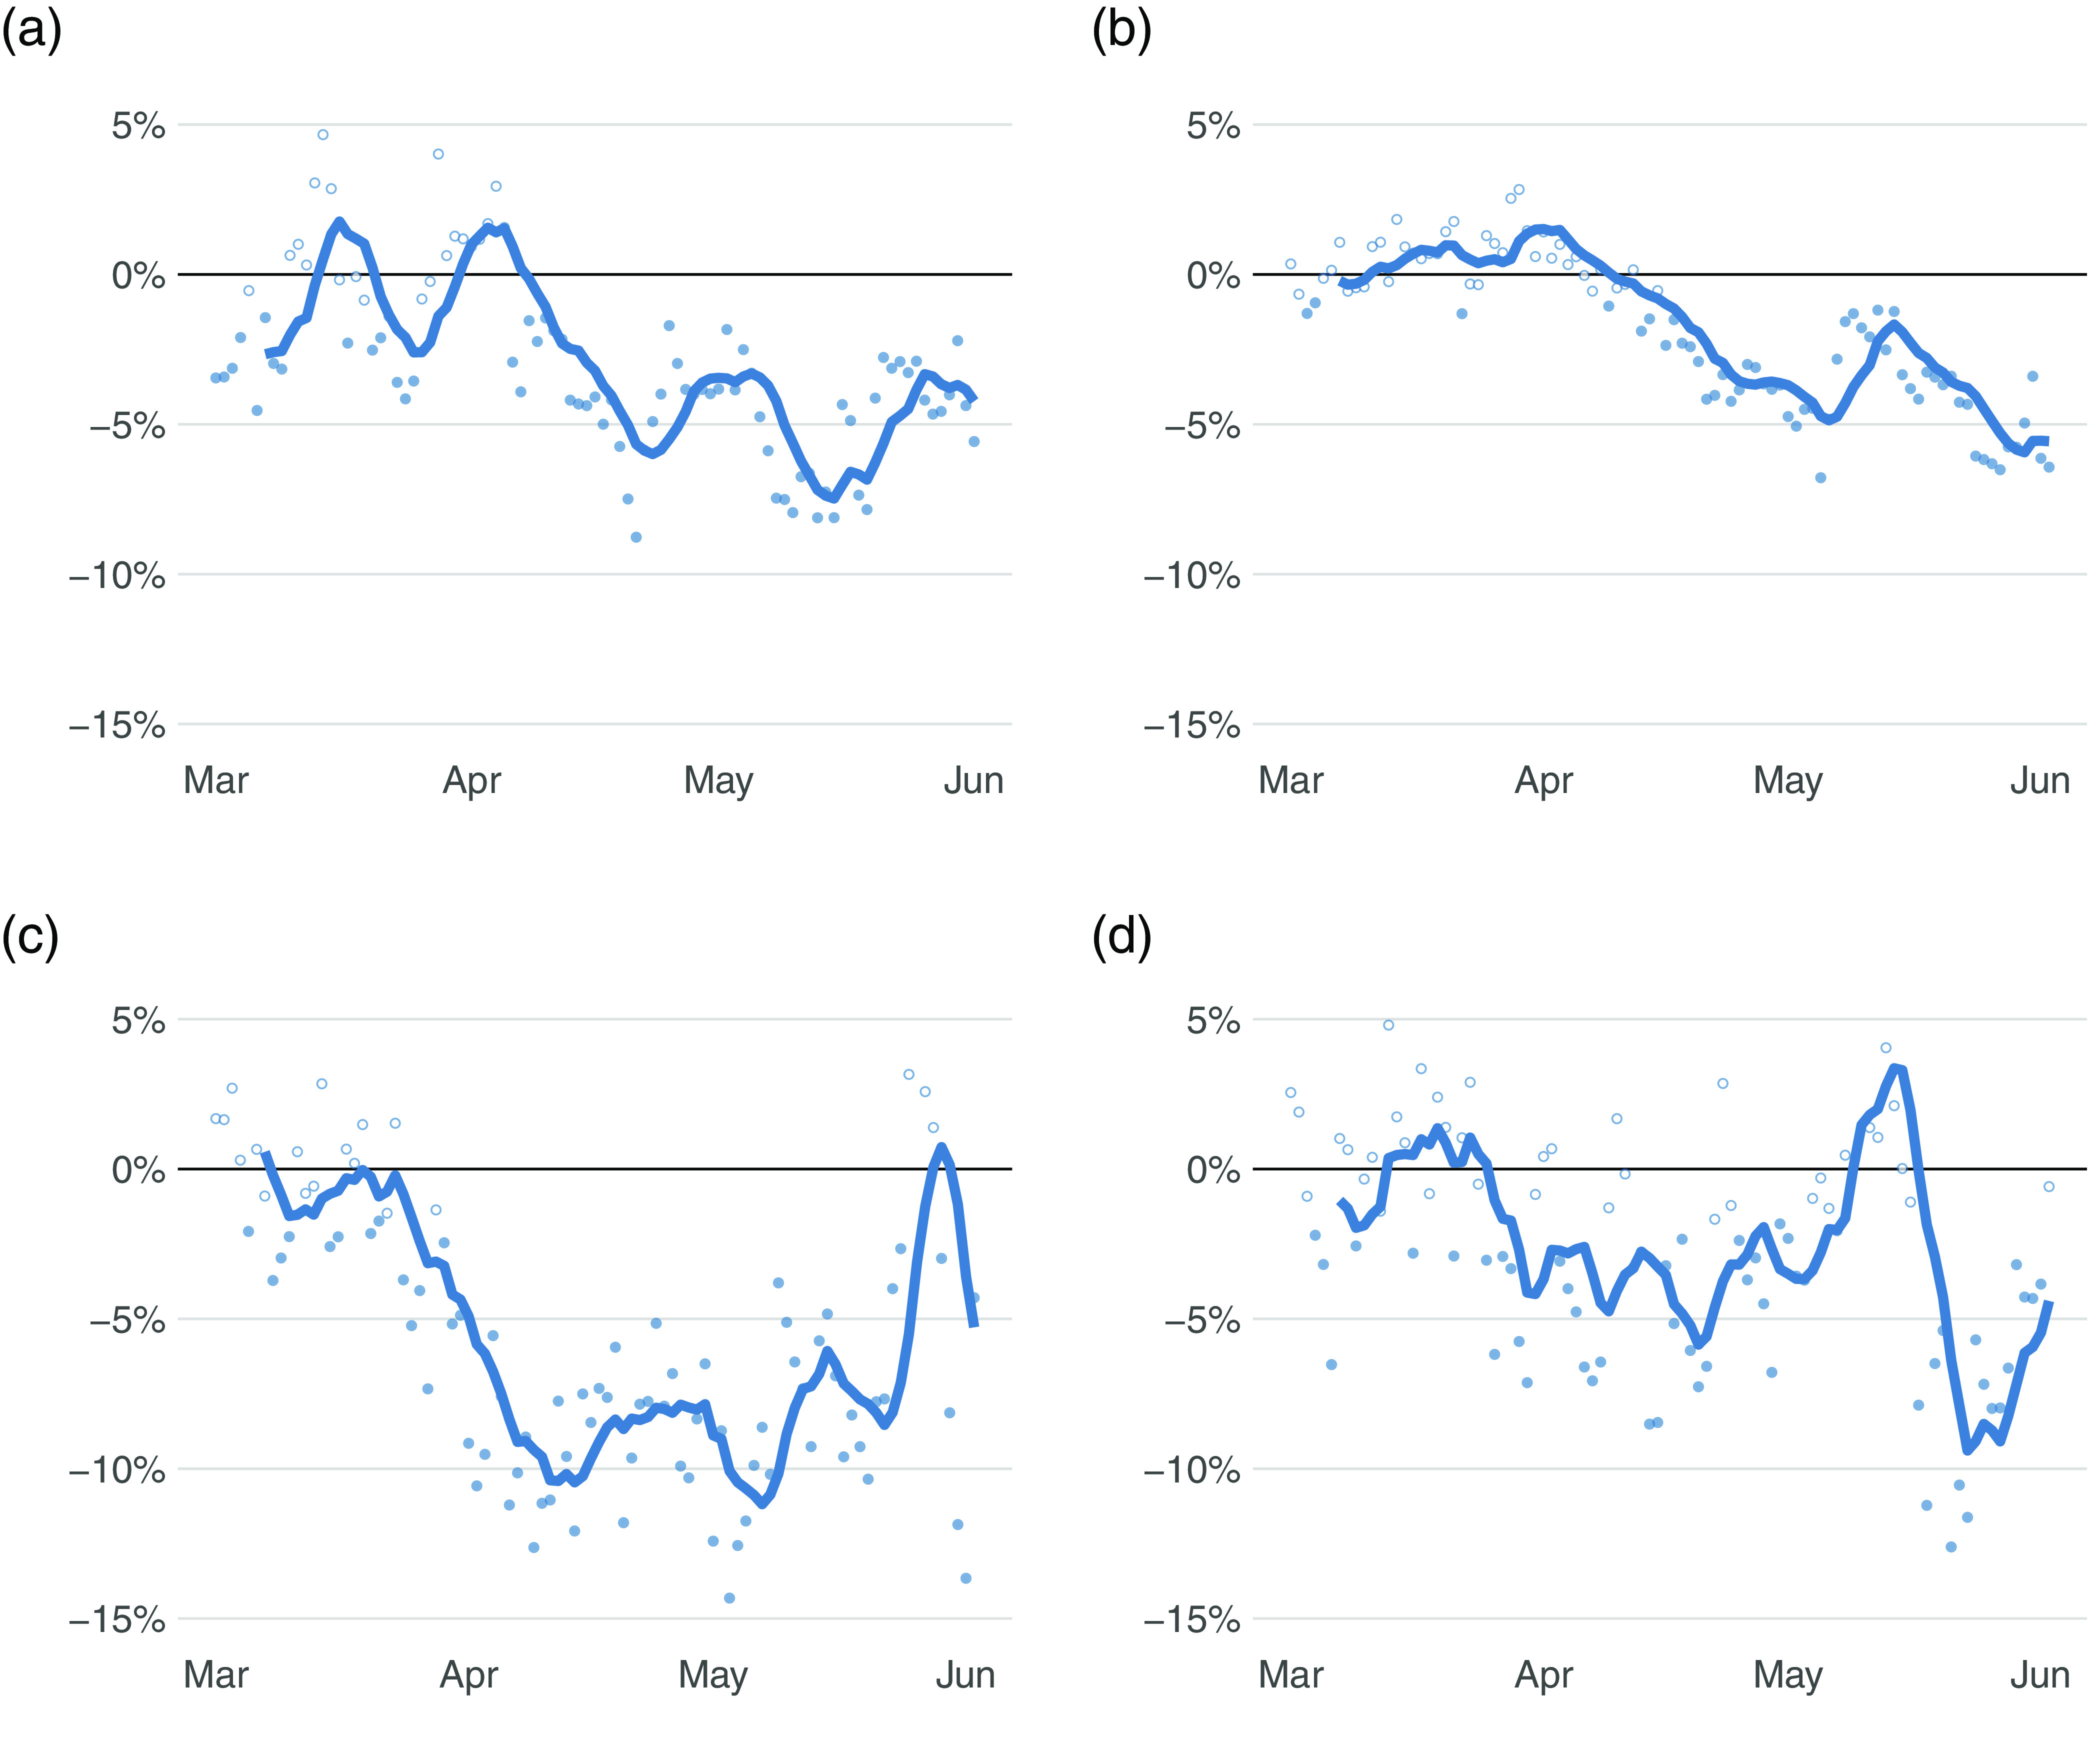
Figure 1:
Daily Electricity Demand Relative to Expected Demand During COVID-19: (a) British Columbia, (b) Alberta, (c) Ontario, and (d) New Brunswick

Notes: Solid lines represent seven-day moving averages for coefficients of daily fixed effects during the COVID-19 period from Equation (1). Individual dots are the daily fixed-effects coefficients from Equation (1), with solid dots indicating that we can reject the one-sided null hypothesis that the estimate is greater than zero at the 5 percent significance level. COVID-19 = coronavirus disease 2019.
Sources: AESO (2020b), BC Hydro (2020), IESO (2020a), NB Power (2020), and Environment Canada (2020); authors’ calculations.
