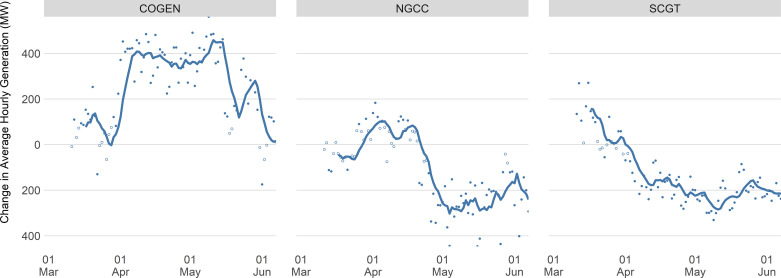
Figure 6 .
Estimated Change in Natural Gas Generation during COVID-19 by Plant Type, Alberta
Notes: Solid lines represent seven-day moving averages for estimated daily fixed effects during the COVID-19 period. Individual points show estimated daily fixed effects, with each point filled on the basis of the p-value of a two-sided t-test for zero effect (solid fill indicates p ≤ 0.05). COVID-10 = coronavirus disease 2019.
Source: AESO (2020b) supply and trade data as aggregated by NRGStream and Environment Canada (2020) temperature data; authors’ calculations.

