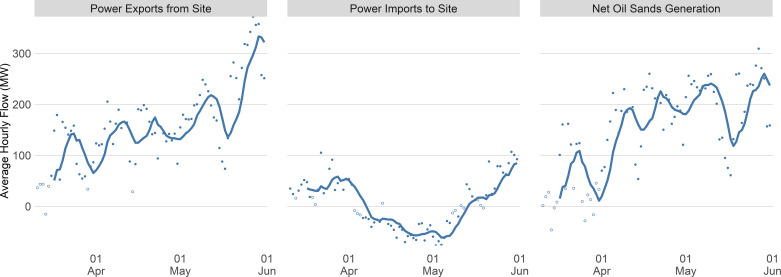
Figure 7 .
Estimated Change in Oil Sands Facility Generation and Load During COVID-19
Notes: Solid lines represent seven-day moving averages for estimated daily fixed effects during the COVID-19 period. Individual points show estimated daily fixed effects, with each point filled on the basis of the p-value of a two-sided t-test for zero effect (solid fill indicates p ≤ 0.05). In addition to the standard regression equation, a fixed effect is included for an outage at Syncrude that occurred in 2017 over the same time of year as the COVID shock, which materially and statistically significantly altered oil sands power flows. COVID-19 = coronavirus disease 2019.
Sources: AESO (2020a) oil sands data and Environment Canada (2020) temperature data; authors’ calculations.

