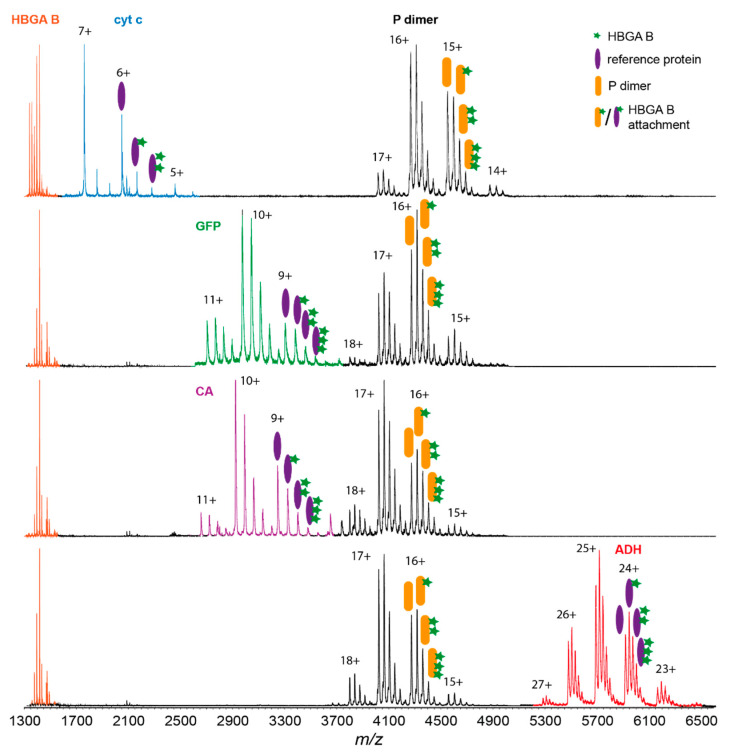
Figure 2.
Native mass spectra of four selected reference proteins. 3 µM reference protein and 1 µM wildtype Saga P dimer (all protein concentrations based on the monomer) are measured with 500 µM HBGA B ligand in 150 mM ammonium acetate solution at pH 7. From top to bottom: cyt c (blue), GFP (green), carbonic anhydrase II (CA, purple), ADH (red). Signal intensity was normalized to the protein base peak. P dimer: 3800–5000 m/z, ADH: 5200–6500 m/z, GFP: 2700-3500 m/z, CA: 2600–3700 m/z.

