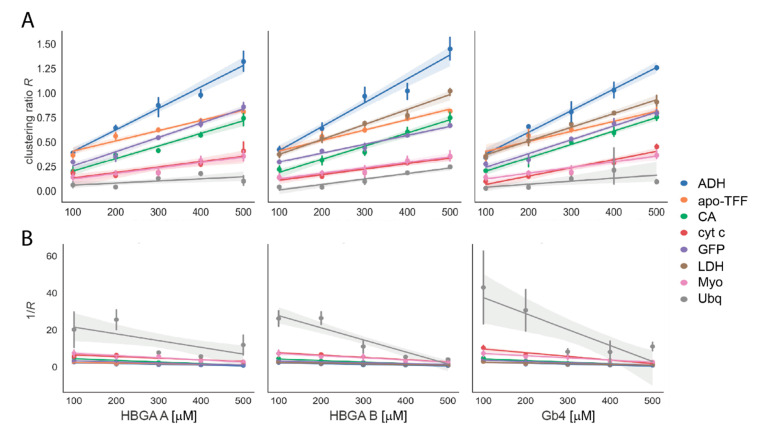
Figure 3.
Correlating glycan concentrations to glycan clustering ratios. (A) R value calculated based on the peak area of the reference proteins (ADH; CA, cyt c, GFP; Myo, Ubq, LDH, apo-TFF). (B) Corresponding reciprocal value. Titration experiments were performed with P dimers (1 µM, monomer) and reference proteins (3 µM, monomer) in 150 mM ammonium acetate solution pH 7 with ligand concentrations ranging from 100 µM to 500 µM for HBGA A, B and Gb4. The shaded areas represent the standard error of the slope for the linear fit.

