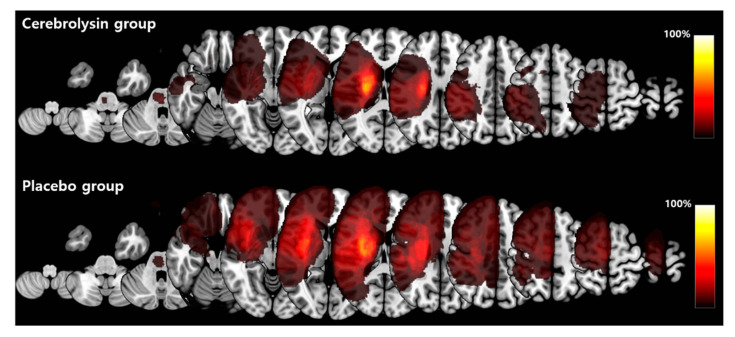
Figure 2.
Group comparison of lesion maps. Each patient’s lesion volume was fitted to the Montreal Neurological Institute (MNI) standard space and results were visualized using MRIcroGL (McCausland Center for Brain Imaging, University of South Carolina, http://www.cabiatl.com/mricrogl, accessed on 7 March 2020). For group comparison, stroke lesions on the left side were flipped to be overlaid on the right hemisphere. The colored bar indicates the percentage of lesion areas in each group.

