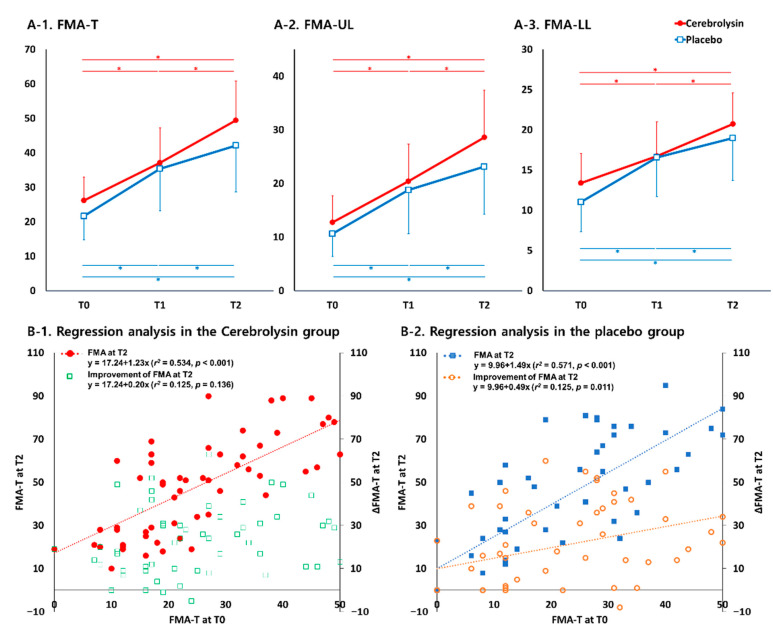
Figure 3.
Changes in Fugl-Meyer assessment (FMA) in the Cerebrolysin and placebo groups. (A-1). Time courses for total FMA; (A-2). Time course for upper limb of FMA (FMA-UL); (A-3). Time course for lower limb of FMA (FMA-LL); A simple regression analysis of the effect of FMA-T baseline scores (T0) on FMA-T at Day 90 (T2) and the improvement from baseline (T0) is shown for Cerebrolysin (B-1) and placebo (B-2) groups. * p < 0.05 between time points in each group (repeated-measures ANOVA).

