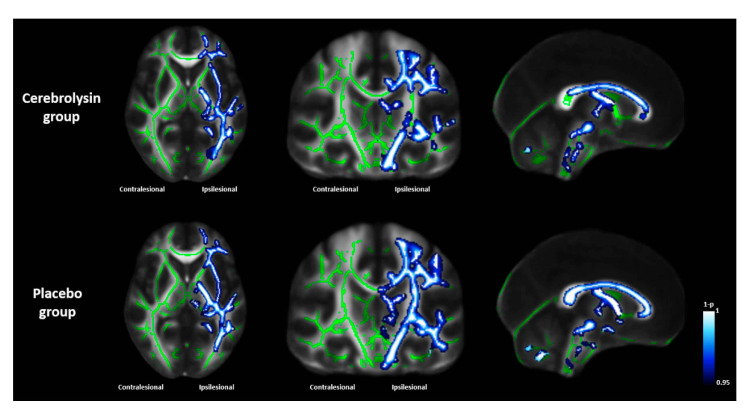
Figure 4.
Changes in voxel-wise fractional anisotropy values from baseline (T0) to Day 90 (T2) using the tract-based spatial statistics technique. The results are presented in axial (z = 3), coronal (y = -21), and sagittal (x = 0) views in MNI standard space. Green voxels represent the mean white matter skeleton of all subjects. Blue-white voxels represent significantly decreased fractional anisotropy of white matter tracts in each group (p < 0.05).

