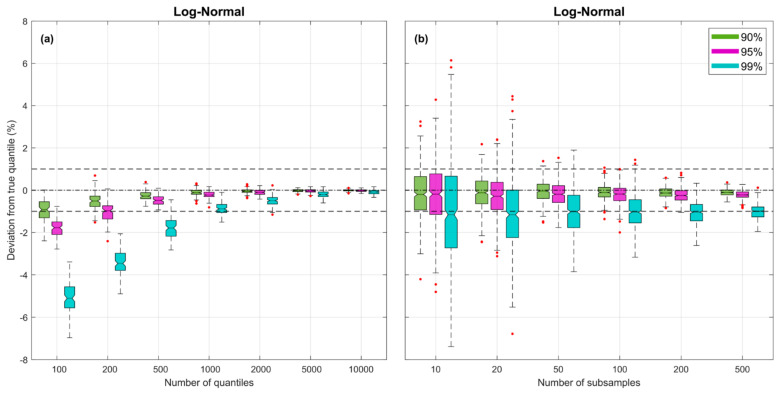
Figure 2.
Plots showing bias and uncertainty associated with estimates of the quantiles derived from random samples, for the Log-Normal pdf. Uncertainty associated with random sampling variability is estimated by repeating each experiment times. In both subplots, for each case, the box plots are shown side by side to improve legibility. (a) Subplot showing results varying for fixed . (b) Subplot showing results varying for fixed .

