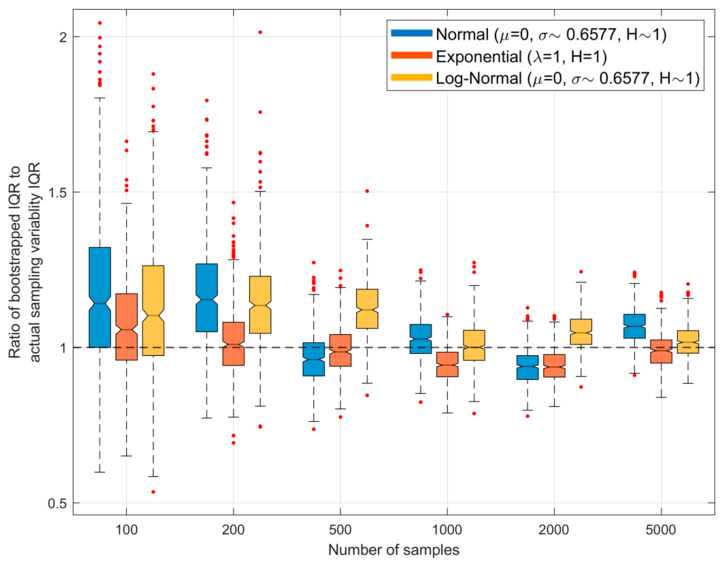
Figure 6.
Plots showing, for different sample sizes and , the ratio of the interquartile range (IQR) of the QS-based estimate of entropy obtained using bootstrapping to that of the actual IQR arising due to random sampling variability. Here, each sample set drawn from the parent density is bootstrapped to obtain different estimates of the associated entropy, and the width of the resulting inter-quartile range is computed. The procedure is repeated for different sample sets drawn from the parent population, and the graph shows the resulting variability as box-plots. The ideal result would be a ratio of 1.0.

