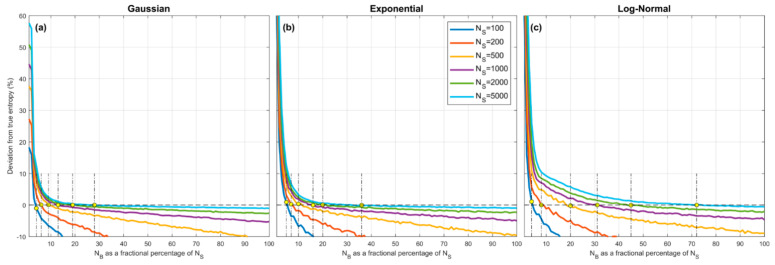
Figure 7.
Plots showing how expected percentage error in the BC-based estimate of Entropy derived from random samples, varies as a function of the number of bins for the (a) Gaussian, (b), Exponential, and (c) Log-Normal densities. Results are averaged over trials obtained by drawing sample sets of size from the theoretical pdf, where and are set to be the smallest and largest data values in the particular sample. Results are shown for different sample sizes . When the number of bins is small the estimation bias is positive (overestimation) but rapidly declines to cross zero and become negative (underestimation) as the number of bins is increased. In general, the overall ranges of overestimation and underestimation bias are larger than for the QS method (see Figure 4).

