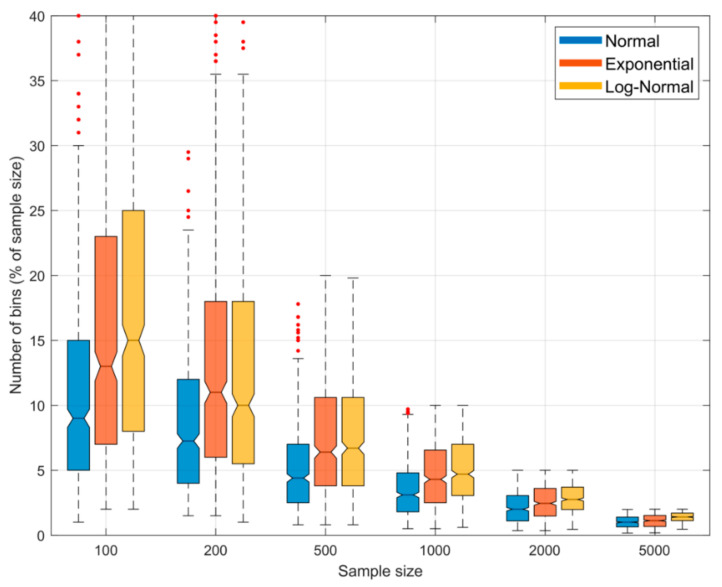
Figure 8.
Boxplots showing the sampling variability distribution of optimal fractional number of bins (as a percentage of sample size) to achieve zero bias, when using the BC method for estimating entropy from random samples. Results are shown for the Gaussian (blue), Exponential (red) and Log-Normal (orange) densities. The uncertainty estimates are computed by drawing different sample data sets of a given size from the parent distribution. Note that the expected optimal fractional number of bins varies with shape of the pdf, and is not constant but declines as the sample size increases. This is in contrast with the QS method where the optimal fractional number of bins is constant at for different sample sizes and pdf shapes. Further, the variability in optimal fractional number of bins can be large and highly skewed at smaller sample sizes.

