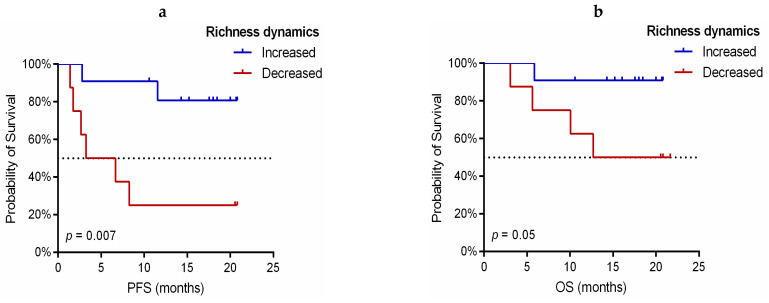
Figure 4.
Kaplan–Meier survival curves according to TCR-β richness dynamics in anti-PD-1 treated NSCLC patients. (a) Progression-free survival (PFS) stratified in increased (n = 11) vs. decreased richness (n = 8). (b) Overall survival (OS) stratified in increased (n = 11) vs. decreased richness (n = 8). P-values were obtained using the log-rank test.

