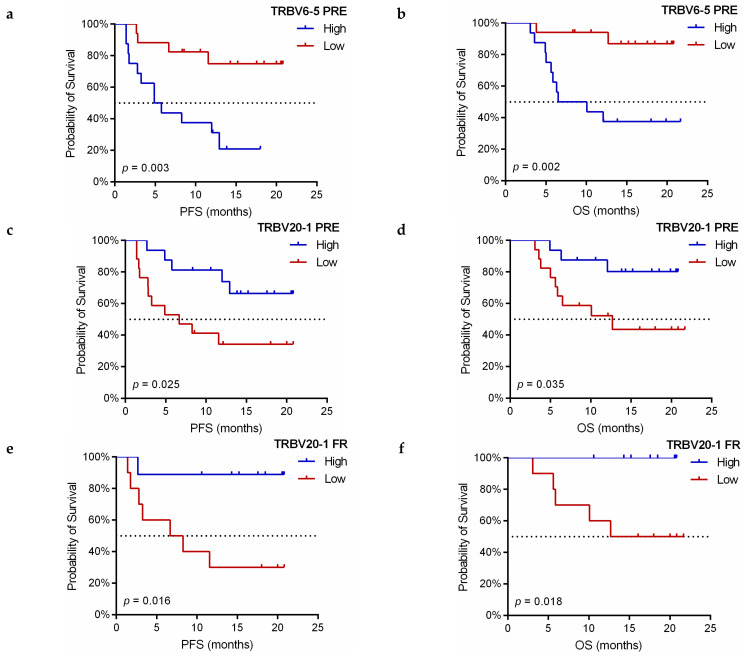
Figure 8.
Kaplan–Meier survival curves according to V-gene usage in anti-PD-1 treated NSCLC patients. (a,b) Progression-free survival (PFS) and overall survival (OS) curves in terms of PRE TRBV6-5 frequency. (c,d) PFS and OS curves in terms of PRE TRBV20-1 frequency. (e,f) PFS and OS curves in terms of FR TRBV20-1 frequency. The median frequency values were used as cutoff values (2.53% for PRE TRBV6-5, 9.14% for PRE TRBV20-1, and 9.02% for FR TRBV20-1, respectively). PRE: pretreatment, FR: first response assessment, p-values were obtained using the log-rank test.

