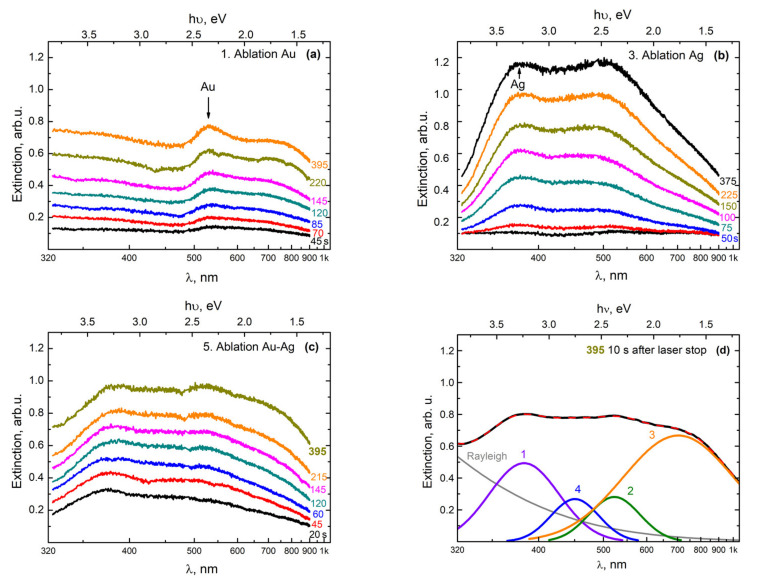
Figure 3.
Transformation of the extinction spectra of a colloidal solution scCO2 during successive cycles of ablation of the (a) gold and (b) the silver parts of the target. (c) Simultaneous ablation of both parts in configuration 2. The numbers on the curves show the times from the beginning of the ablation in seconds. The numbers to the right of the curves show the times in seconds since the start of the ablation cycle. (d) Variation of the decomposition of the spectrum obtained 10 s after the end of the last stage of ablation (red line) into the sum (black dashed line) of individual Gaussian components (1–4) and the Rayleigh scattering component (Rayleigh).

