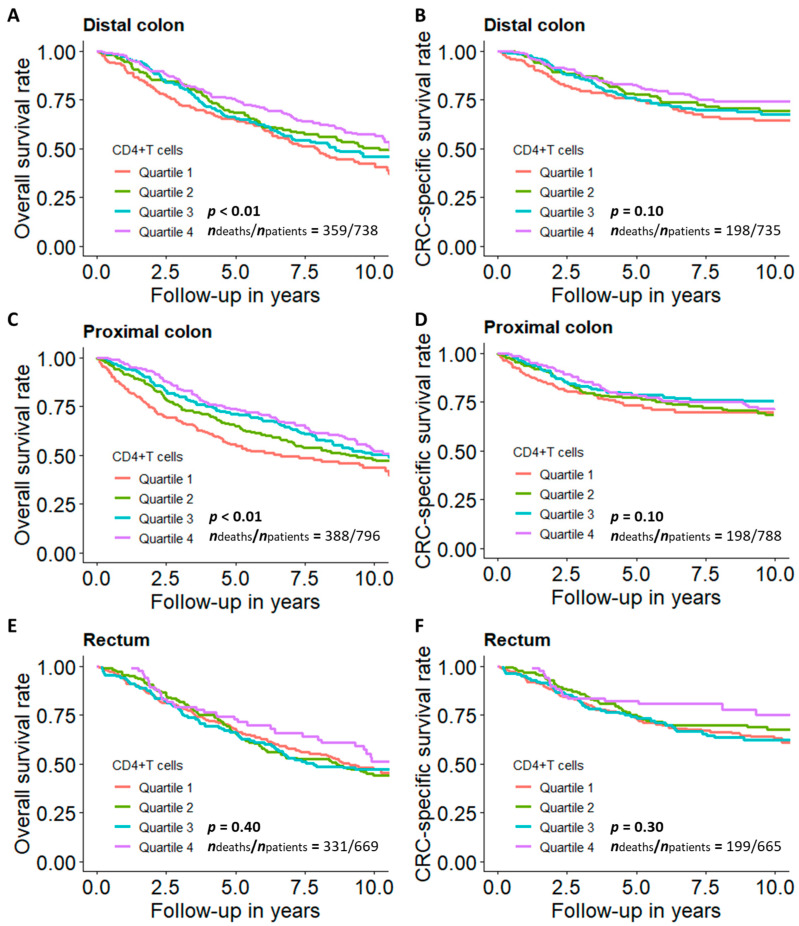
Figure 4.
Survival curves for CRC patients across quartiles of CD4+ T cell proportions by tumor subsite. (A) Overall and (B) CRC-specific survival curve among patients with distal colon cancer; (C) overall and (D) CRC-specific survival curve among patients with proximal colon cancer; (E) overall and (F) CRC-specific survival curve among patients with rectal cancer. Note: Survival curves were adjusted for age, sex, tumor stage, timing of blood sampling and batch. p values were derived from G-rho family of tests. Quartile 1: lowest quartile; Quartile 4: highest quartile.

