Figure 3.
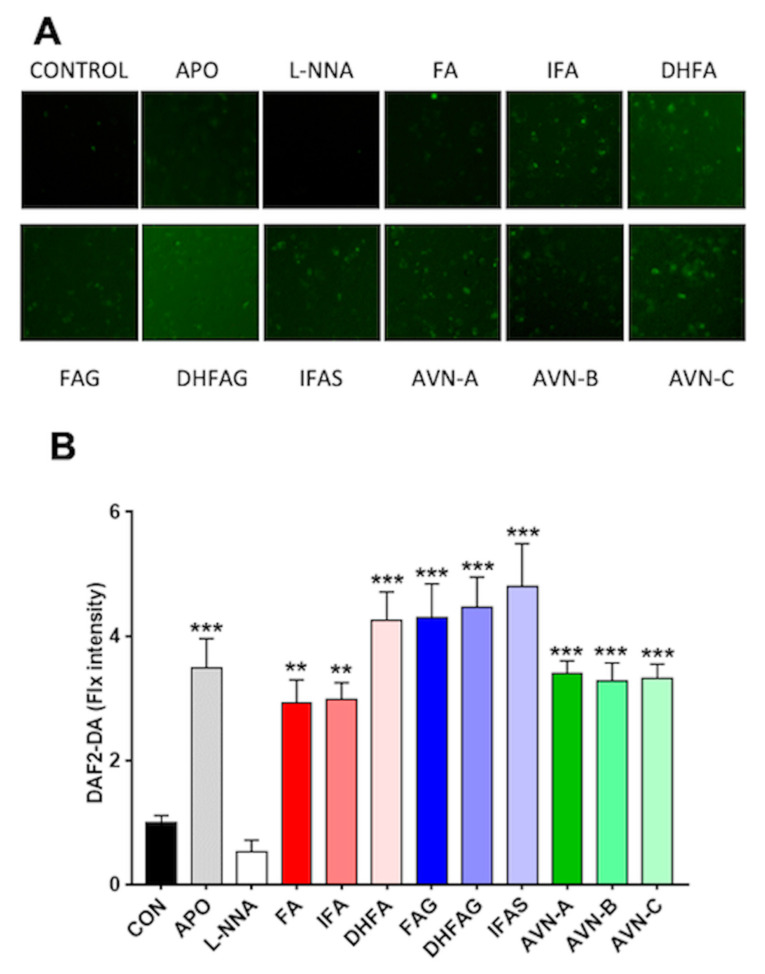
NO levels in HUVEC as visualized by DAF-2DA fluorescence (A) and relative fluorescence intensities (B), after pre-treatment with the oat phenolics and metabolites (1 µM), ferulic acid (FA) isoferulic acid (IFA), dihydroferulic acid (DHFA), FA glucuronide (FAG), DHFA glucuronide (DHFAG), IFA sulfate (IFAS), avenanthramide A (AVN-A) avenanthramide B (AVN-B) avenanthramide C (AVN-C), apocynin (APO, 100 µM) or L-NG-Nitro-Arginine (L-NNA, 100 µM) for 24 h. Images in panel A are a representative example, whereas data with error bars in panel B represent the average ± SEM of 6 independent experiments and are expressed as fold change (control, CON, =1). ** = p < 0.01, *** = p < 0.001 vs. control (n = 6).

