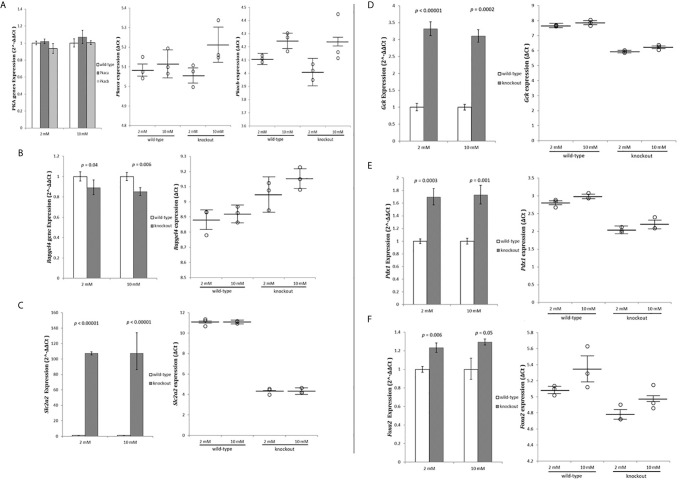
Figure 4.
Exome data analysis strategy. RIN-m(-/- Adcy7 ) mRNA level under 2mM glucose and 10mM glucose concentration established by quantitative RT-PCR. The CT values were normalized to β-actin to yield ΔCT and 2^-ΔΔCT values presented in dots and bar chart, respectively. Each dot represents an individual sample, whereas the horizontal lines represent the mean and standard error of the mean. ΔCT values were then calculated and presented as 2^-ΔΔCT values (fold change) in a bar chart. (A) PRKACs alpha (Prkaca) and beta (Prkacb) expressions, (B) Rapgef4, (C) Slc2a2, (D) Gck, (E) Pdx1, (F) Foxa2. Unpaired t-test with delta CT and SE ± values were used for statistic test.

