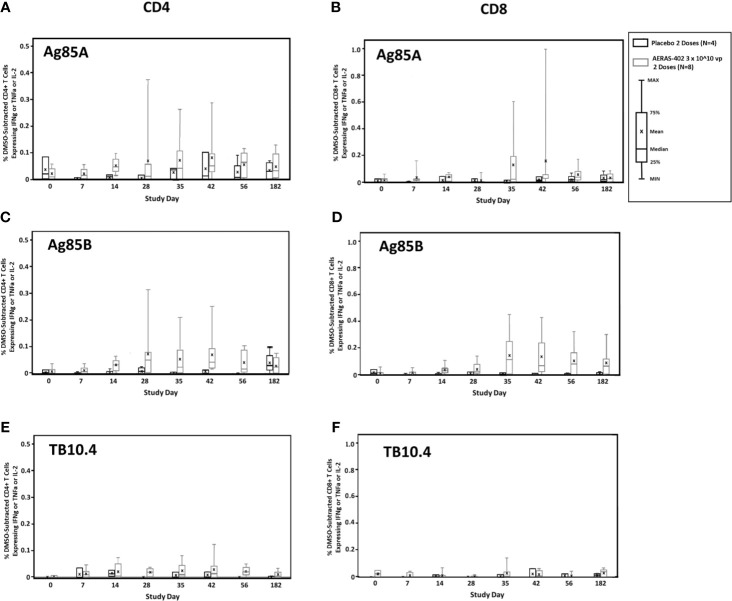
Figure 2.
T cell responses to vaccine-encoded antigens. PBMCs were thawed, rested overnight, and stimulated for 5-6 hours with DMSO (negative control), SEB (positive control), or peptide pools corresponding to the vaccine antigens Ag85A (A, B), Ag85B (C, D), or TB10.4 (E, F). Specimens were then stained for viability, phenotypic markers, and intracellular cytokine expression and evaluated by flow cytometry. Data were analyzed using FlowJo software to generate cytokine Boolean gates. Each gate was subjected to DMSO subtraction to remove background. Negative results following DMSO-subtraction were set to zero. The sum of these gates was then used to determine the total cytokine response for CD4+ (A, C, E) and CD8+ (B, D, F) T cells for the AERAS-402-vaccinated (grey bars) or placebo control (black bars) groups. Bars are plotted for each group and time point for the total response (any cytokine alone or in combination for IFN-γ or IL-2 or TNF-α). Bars represent the 25th to 75th percentile, with the cross bar representing the median response. The mean is indicated by an “x” and the error bars represent the minimum and maximum responses.

