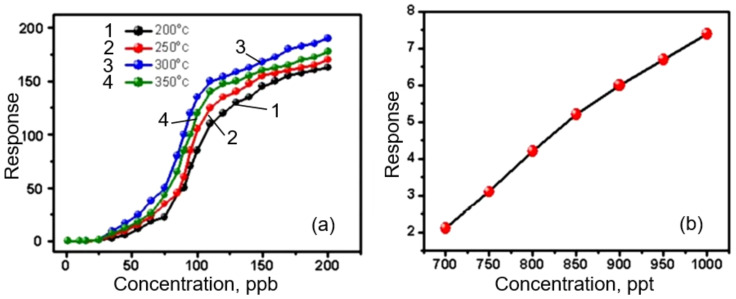
Figure 4.
(a) Response of pure TiO2 single nanofiber triangular sample in the presence of CO gas as a function of concentration at 200−350 °C. (b) The response of TiO2:Au triangular samples in the presence of CO gas as a function of concentration in ppt range at 250 °C. Reprinted with permission from [86]. Copyright 2017 ACS.

