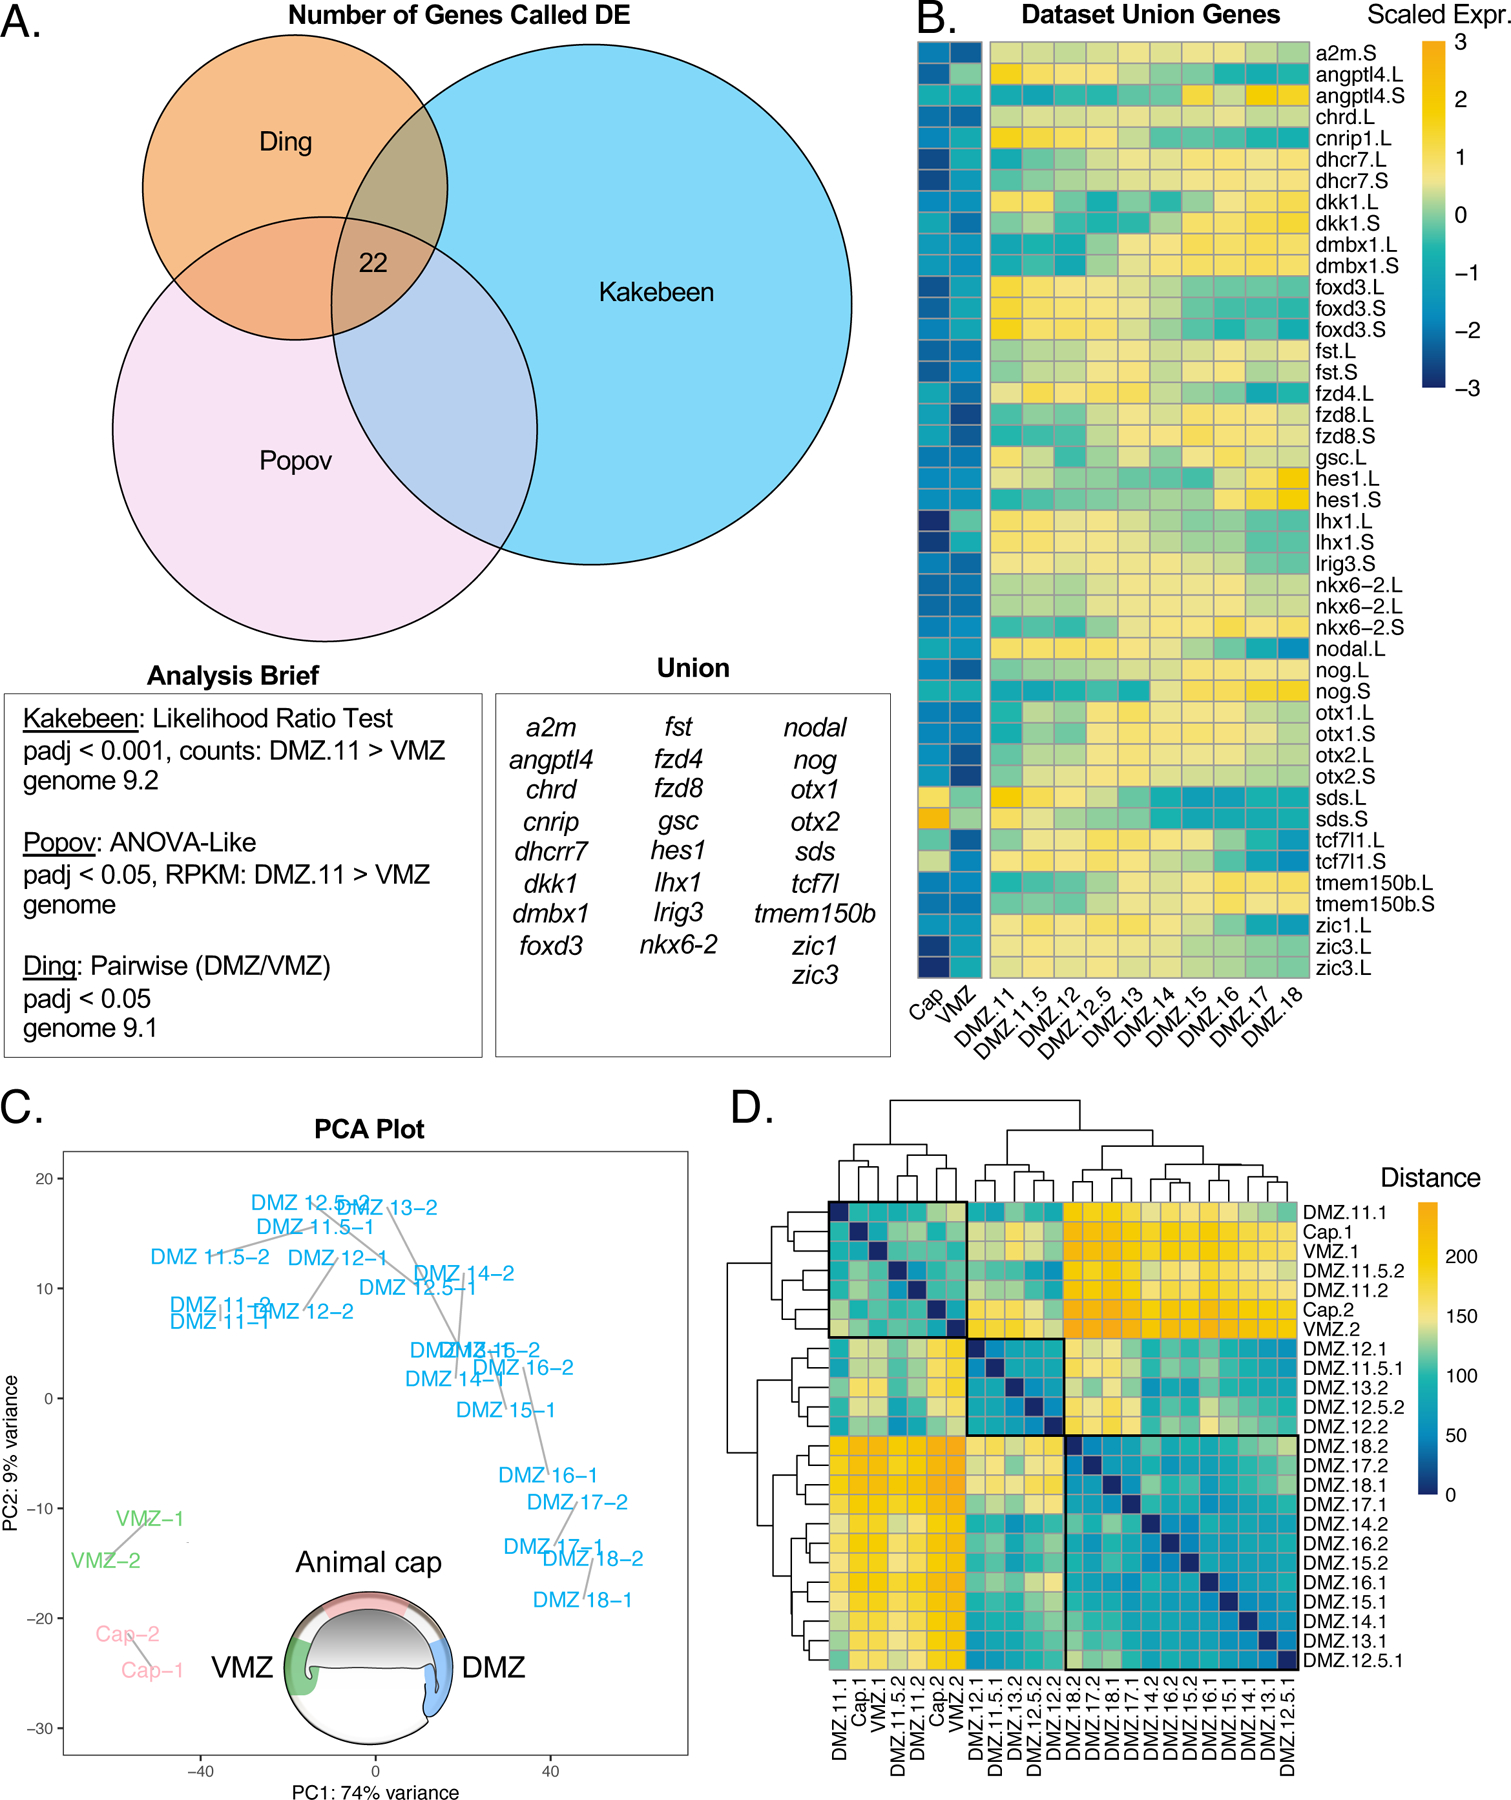
Figure 2. Cultured DMZs can be temporally differentiated by their global transcriptomes.

A) Venn diagram comparing genes enriched in the DMZ with respect to the VMZ in three independent studies. Differential expression analysis for each data set are reported followed by the genes representing the union of all three data sets. B) Heatmap showing gene expression of genes captured by the union of all three data sets. Color represents expression of gene scaled by row. C) PCA plot clustering all samples. Blue samples are cultured DMZ, green samples are cultured VMZ, and pink samples are cultured animal caps. D) Correlation heatmap demonstrating the calculated distance between samples. Hierarchical clustering was performed by Pheatmap.
