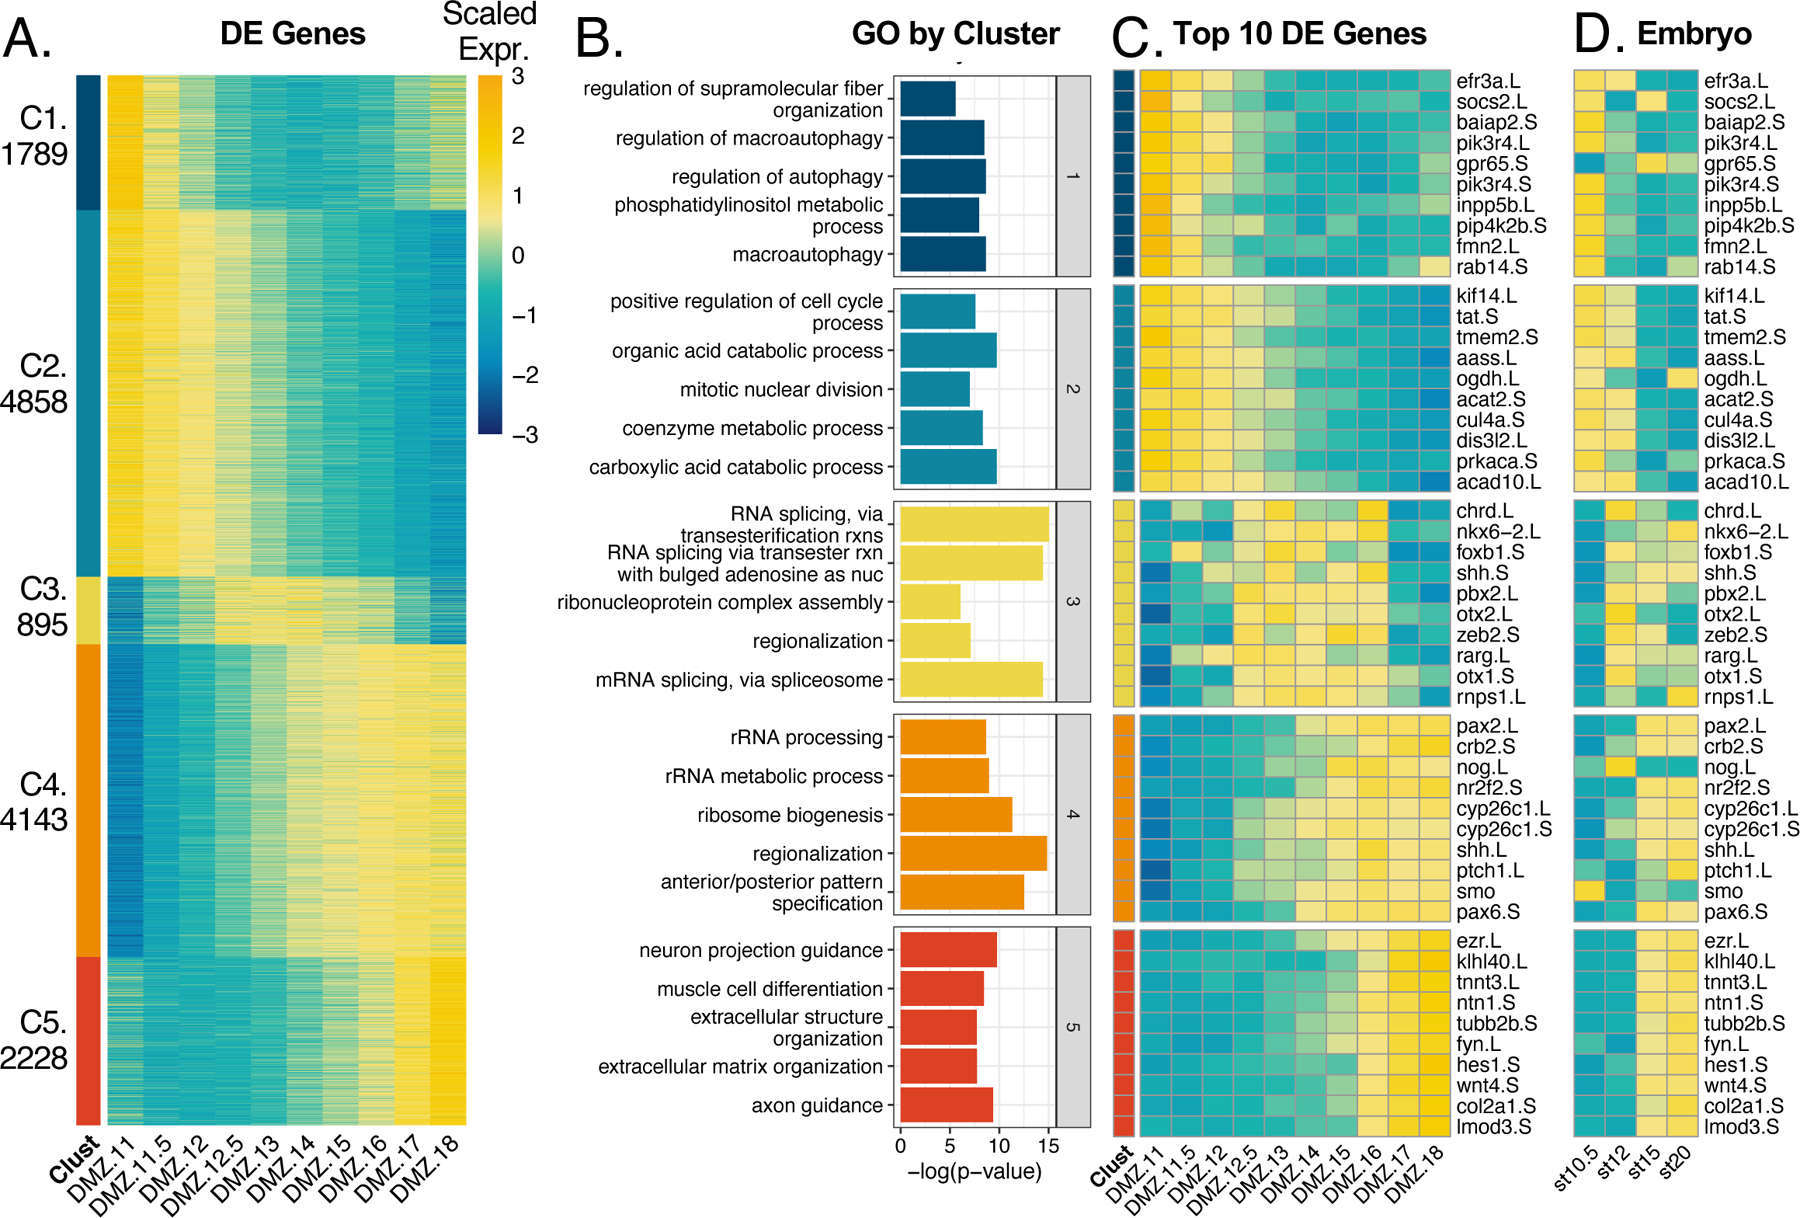
Figure 3. Cultured DMZs cluster to 5 k-means clusters.

A) Heatmap of all differentially expressed genes clustered to 5 k-means clusters. B) Gene ontology analysis results from GO analysis on all genes per cluster. C) Heatmap of top 10 genes by FDR from each cluster. Color in heatmaps represent expression of gene scaled by row D) Heatmap of the same genes in C, plotted from published data in the whole embryo at complimentary developmental timepoints.
