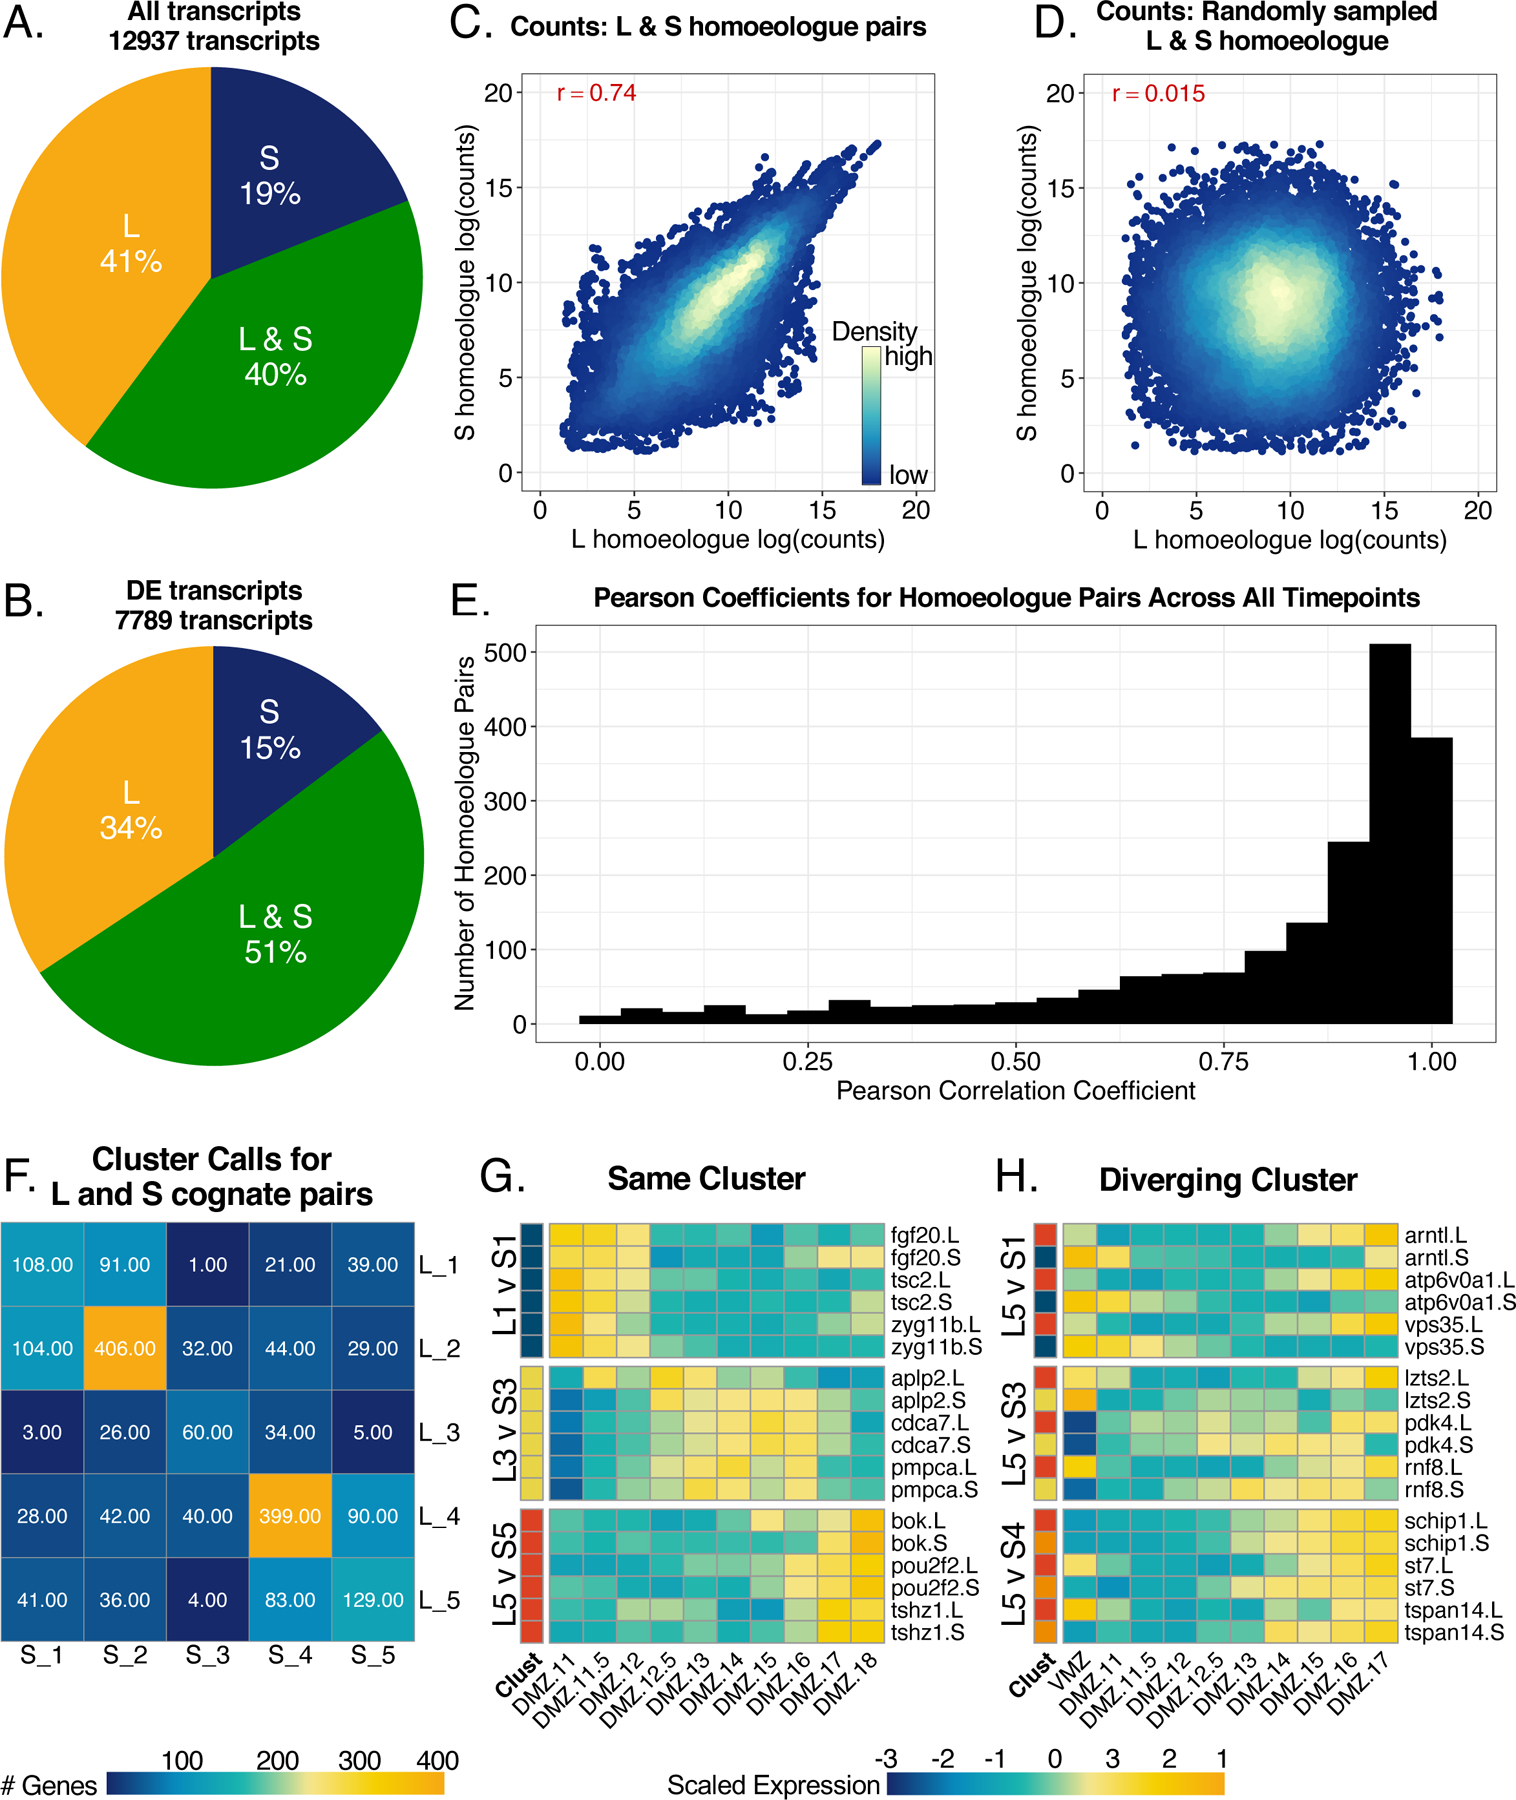
Figure 5. L and S homoeologues are differentially represented and may have differential expression between cognate pairs.

A) Pie chart demonstrating the distribution of only L homoeologues, only S homoeologues, and genes with L and S homoeologues across all transcripts in our dataset. B) Distribution of homoeologues in only differentially expressed genes. Genes in the L and S category must have both L and S homoeologues be differentially expressed. C) Correlation plot for log(counts) of L vs. S homoeologues for cognate pairs in all samples. The red number represents the pearson correlation coefficient. D) Correlation of randomly sampled L and S homoeologue log(counts) from all samples. E) Histogram of pearson correlation coefficients calculated for each differentially expressed gene with and L and S homoelogues across DMZ time. F) Heatmap representing the number of genes with L and S homoeologues with each unique cluster call pairing. G) Heatmap showing examples of congruent expression patterns of homoeologues called in the same cluster. H) Heatmap showing examples of expression patterns of homoeologues that were called in different clusters. Color represents expression of gene scaled by row in heatmaps from (G/H).
