Figure 1.

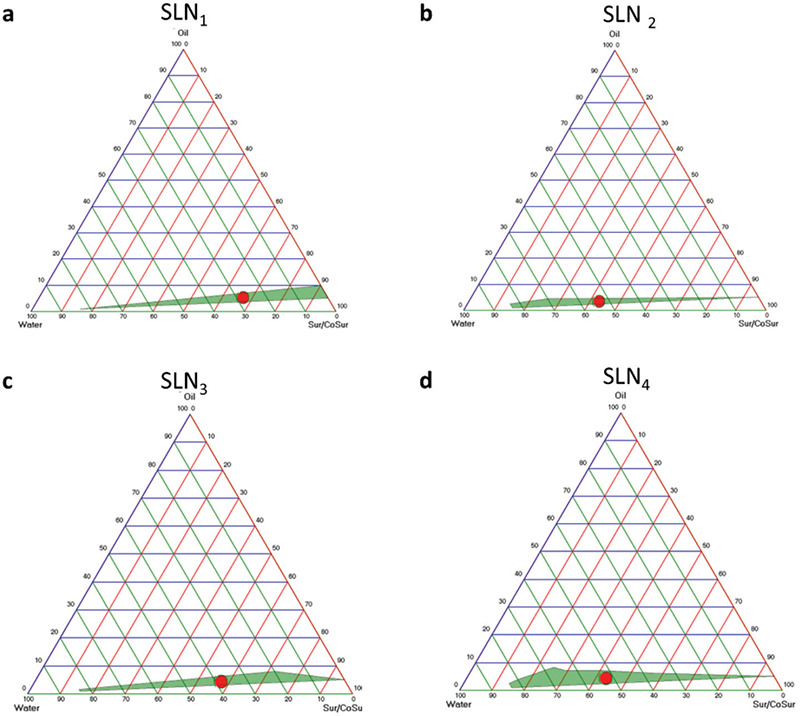
(a-d) Pseudo-ternary phase diagrams for different formulations, namely SLN1, SLN2, SLN3, and SLN4. The green area represents the transparent o/w microemulsion formation region
SLN: Solid lipid nanoparticle

(a-d) Pseudo-ternary phase diagrams for different formulations, namely SLN1, SLN2, SLN3, and SLN4. The green area represents the transparent o/w microemulsion formation region
SLN: Solid lipid nanoparticle