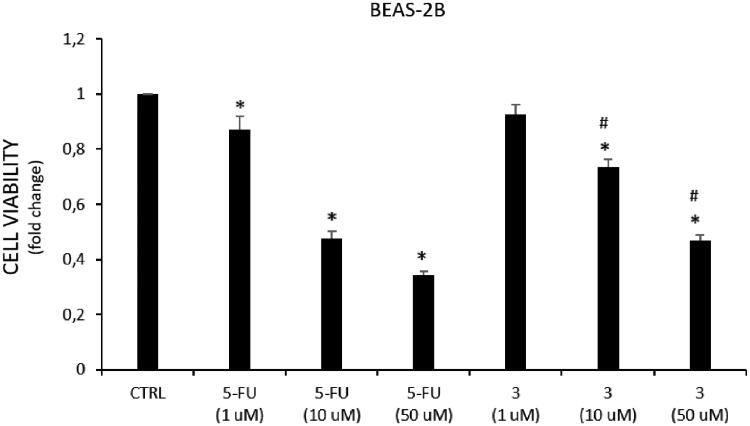
Figure 5.
Effect on cell viability of tested compounds in BEAS cells. Cell viability is expressed as fold change in viability from the control in treated cells (72 h). Data are presented as mean ± SEM (n = 8) of four independent experiments. * Significant vs. untreated control cells: p < 0.05; # Significant vs. 5-FU treated cells: p < 0.05.

