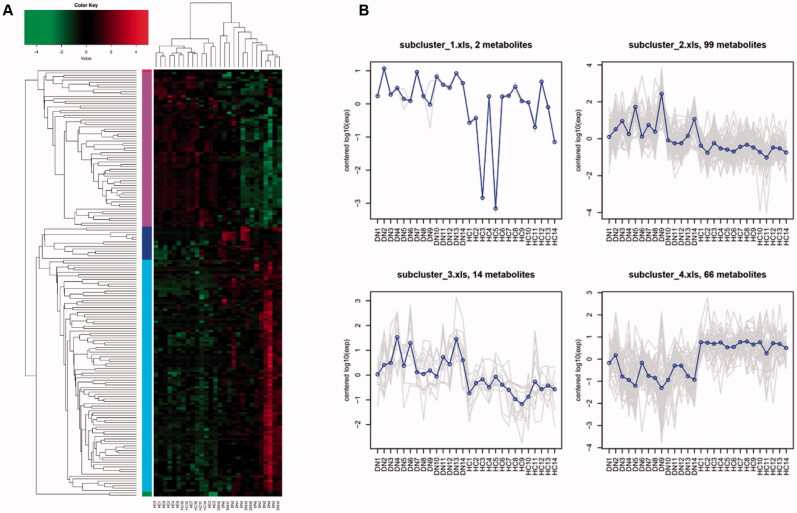
Figure 3.
HCA for important differential metabolites between DGs and HCs. (A) Hierarchical clustering and heatmap of all 182 metabolites that were identified to be significantly different (p ≤ 0.05) in concentration between DGs (n = 14) and HCs (n = 14). (B) Trend line charts of 4 subclusters presenting average expression level of the important differential metabolites they contained.

