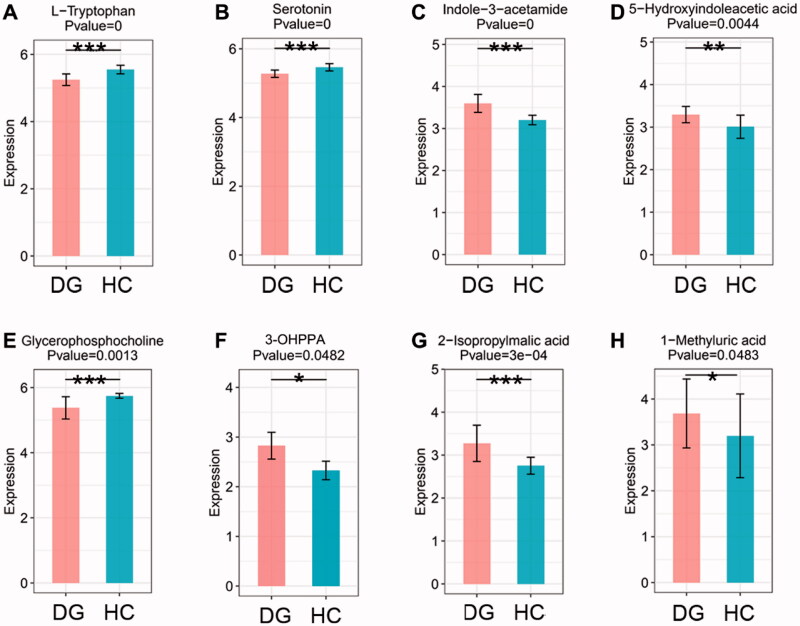
Figure 5.
The boxplots showing the comparison of the relative expression level of four important differential metabolites of tryptophan metabolism and other four selected metabolites between DGs and HCs. (A) L-Tryptophan. (B) Serotonin. (C) Indole-3-acetamide. (D) 5-Hydroxyindoleacetic acid. (E) Glycerophopshocholine. (F) 3-(3-hydroxyphenyl)propionic acid (3-OHPPA). (G) 2-Isopropylmalic acid. (H) 1-methyluric acid. *p < 0.05, **p < 0.01 and ***p < 0.001 vs. HCs. M: metabolism; HD: human diseases; OS: organismal system.

