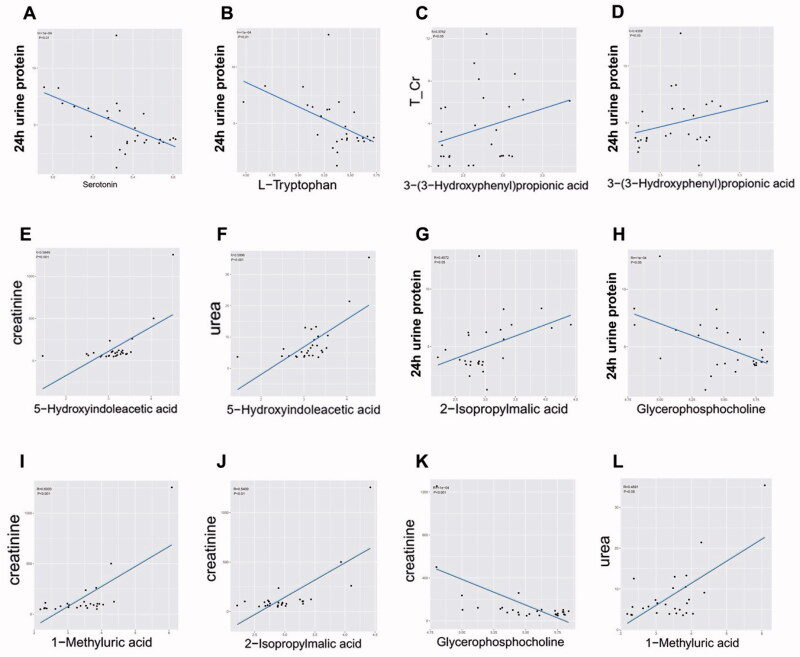
Figure 7.
A-L. The linear regression plots of the correlation relationship between 7 selected important differential metabolites (containing 3 important differential metabolites of tryptophan metabolism) and 4 crucial renal indices (i.e., 24 h urine protein, T/Cr: serum urea and creatinine). T/Cr: urine total protein and creatinine ratio.

